Fig. 4
Download original image
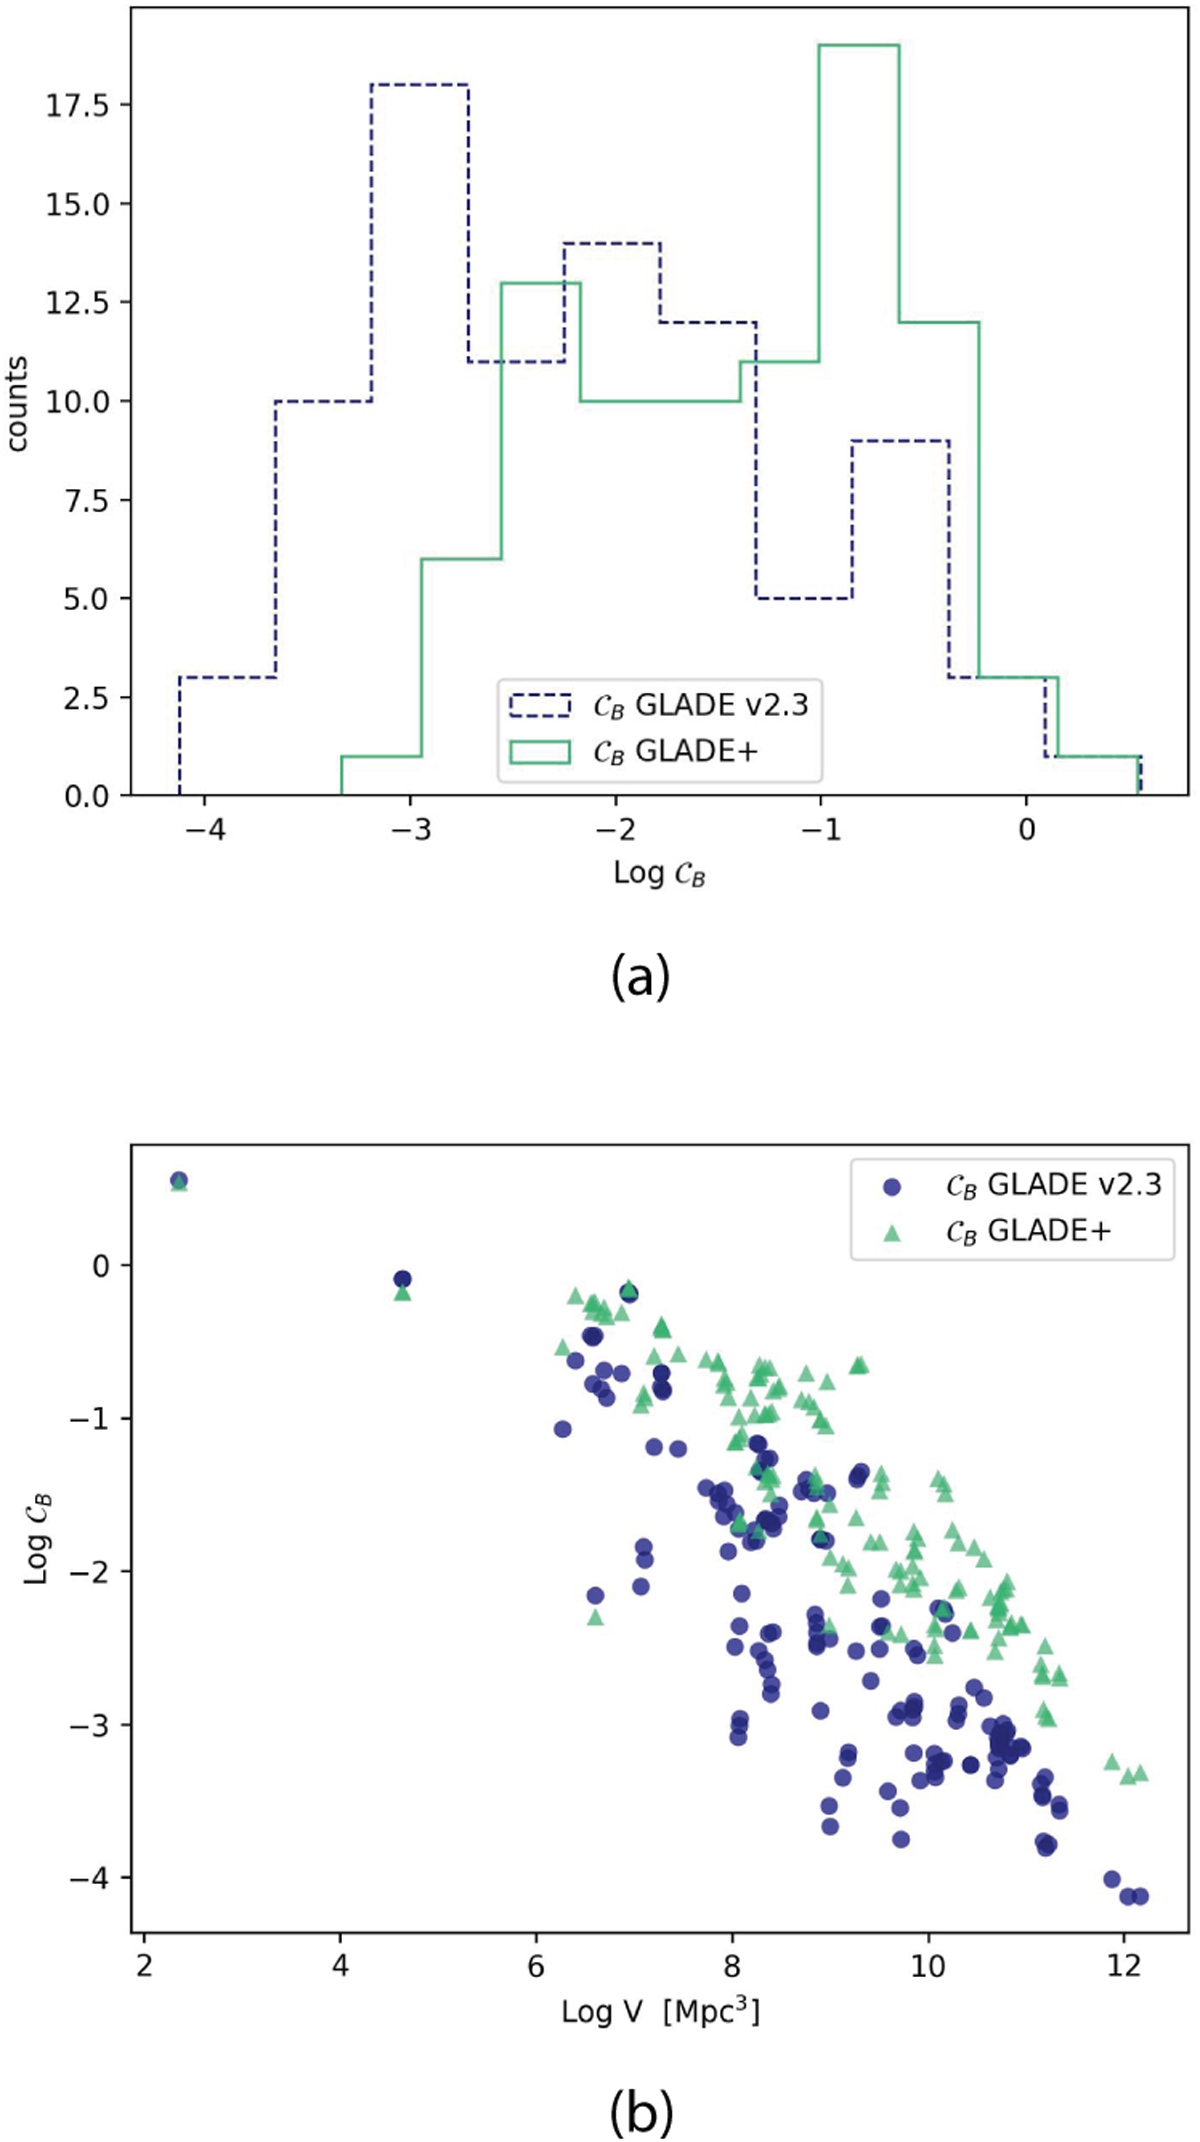
Completeness coefficient distributions in the B band, CB, for the 86 selected events. Top panel a: histogram of CB values obtained using GLADE+ (green line) and the older version of GLADE, 2.3, (dashed histogram) on a logarithmic scale. Bottom panel b: scatter plot illustrating CB dependency on the localisation volume. Green triangles represent data from the updated galaxy catalogue, while blue circles represent data from the older one.
Current usage metrics show cumulative count of Article Views (full-text article views including HTML views, PDF and ePub downloads, according to the available data) and Abstracts Views on Vision4Press platform.
Data correspond to usage on the plateform after 2015. The current usage metrics is available 48-96 hours after online publication and is updated daily on week days.
Initial download of the metrics may take a while.