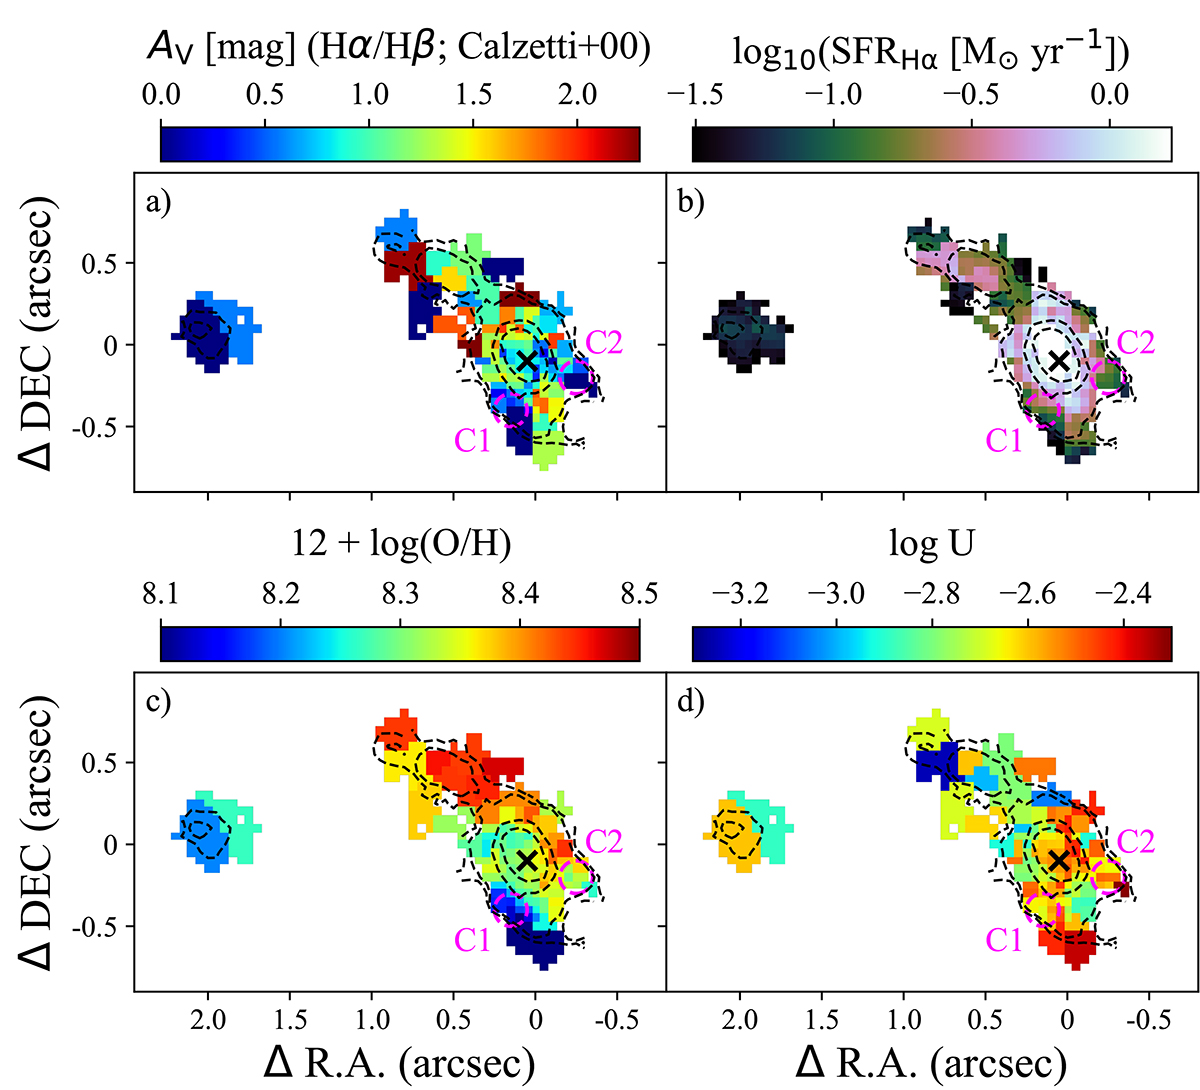
Fig. 7.
Download original image
Maps of the main ISM parameters derived for the GS_4891 galaxy group from emission line analysis. (a) Nebular extinction, AV, derived from the Balmer decrement (Hα/Hβ). (b) SFRs (M⊙ yr−1) estimated from the Hα luminosity. (c) Gas oxygen abundance obtained with the R2, R3, R23, and O32 metallicity calibrations from Curti et al. (2017). (d) Ionisation parameter, U, computed with the gas metallicity and the [O II] λλ3726, 29 lines following Eq. (5) in Díaz et al. (2000). The data were spatially binned to have a S/N ≥ 3 in the emission lines involved. The dashed black contours correspond to the Hα emission, whereas the black cross indicates the centroid of continuum emission.
Current usage metrics show cumulative count of Article Views (full-text article views including HTML views, PDF and ePub downloads, according to the available data) and Abstracts Views on Vision4Press platform.
Data correspond to usage on the plateform after 2015. The current usage metrics is available 48-96 hours after online publication and is updated daily on week days.
Initial download of the metrics may take a while.