Fig. 2.
Download original image
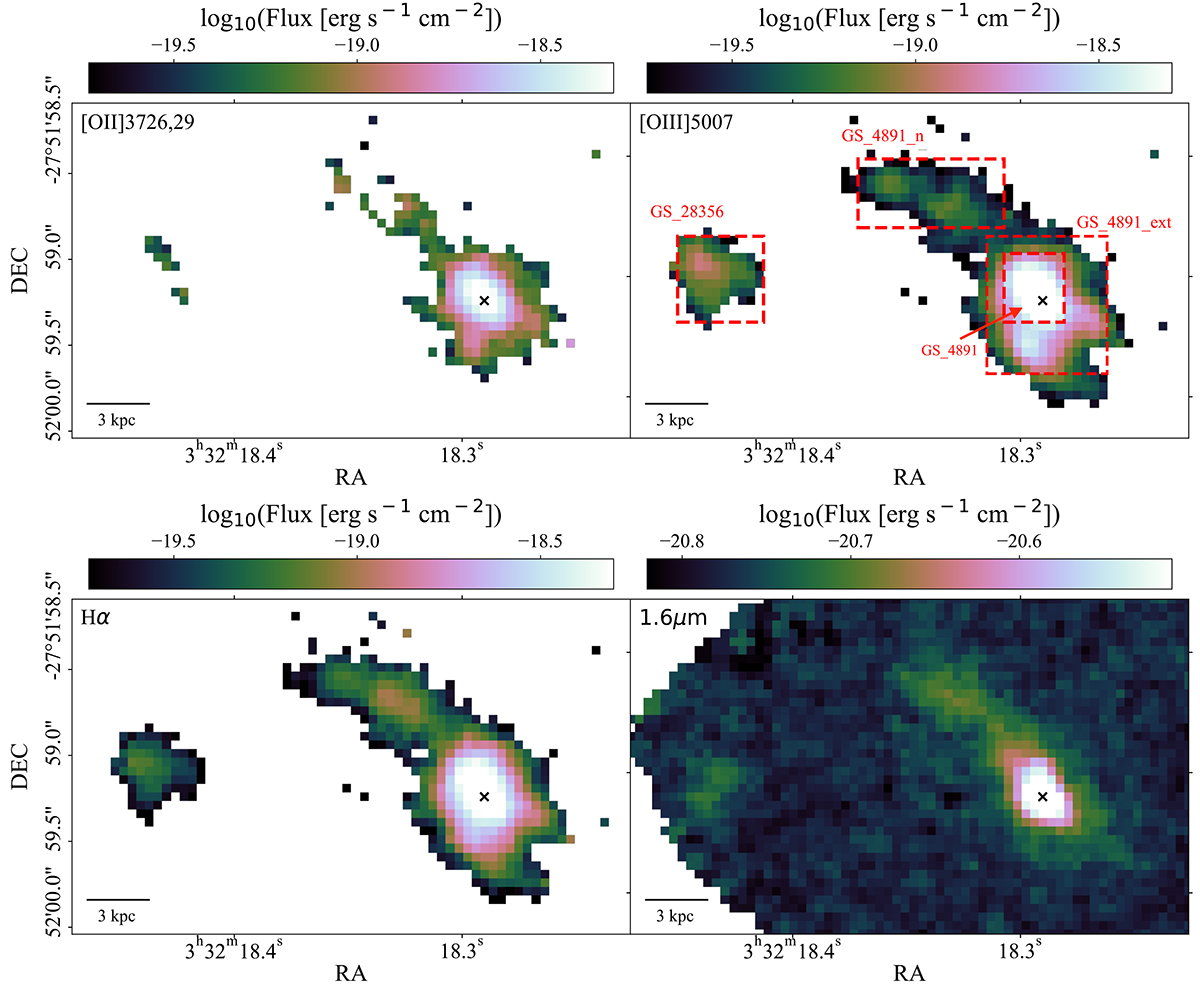
Maps of integrated fluxes in the emission lines [O II] λλ3726, 29, [O III] λ5007, and Hα, and the continuum around 1.6 μm for the GS_4891 system. The three main galaxies identified in the system are highlighted with red rectangles in the top-right panel. The black cross indicates the centroid of continuum emission (see text for details). North is up and east is to the left.
Current usage metrics show cumulative count of Article Views (full-text article views including HTML views, PDF and ePub downloads, according to the available data) and Abstracts Views on Vision4Press platform.
Data correspond to usage on the plateform after 2015. The current usage metrics is available 48-96 hours after online publication and is updated daily on week days.
Initial download of the metrics may take a while.