Fig. 11.
Download original image
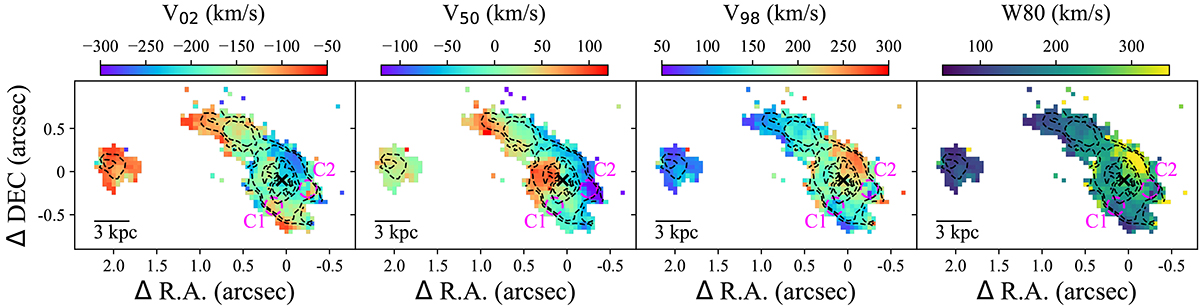
Velocity maps of the ionised gas in the GS_4891 system obtained from the fitting of the [O III] λ5007 and Hα lines. The three left panels show the velocities at the 2nd, 50th, and 98th percentiles of the velocity distributions. The right panel shows the W80 map. The black cross indicates the centroid of continuum emission, whereas the dashed black contours correspond to the Hα emission.
Current usage metrics show cumulative count of Article Views (full-text article views including HTML views, PDF and ePub downloads, according to the available data) and Abstracts Views on Vision4Press platform.
Data correspond to usage on the plateform after 2015. The current usage metrics is available 48-96 hours after online publication and is updated daily on week days.
Initial download of the metrics may take a while.