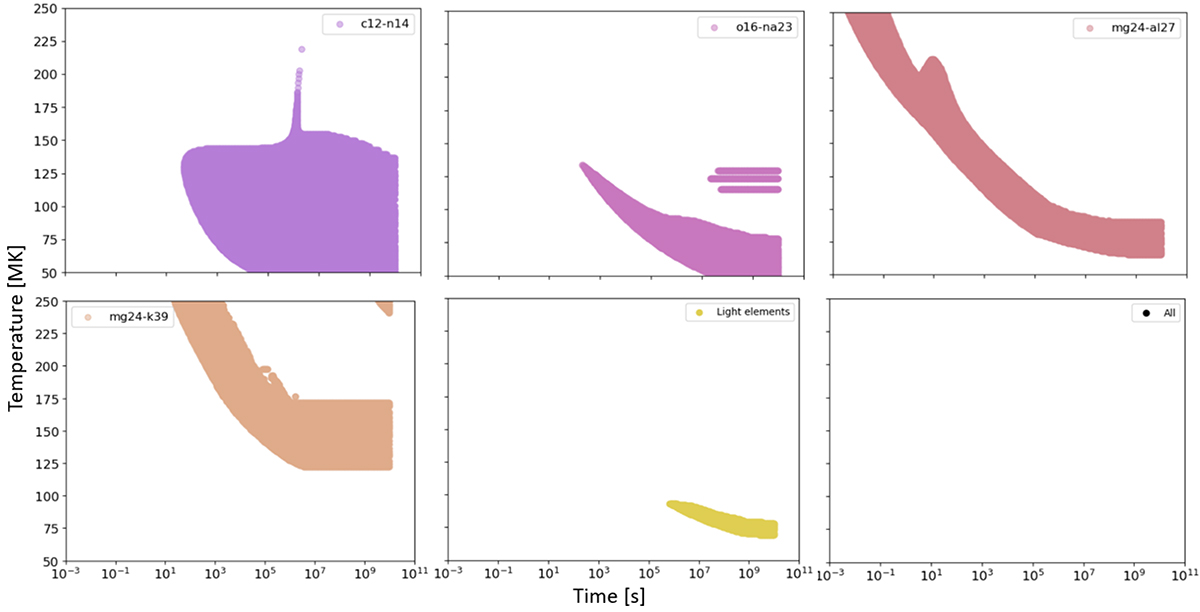
Fig. 4.
Download original image
Temperature and time generating the observed anti-correlations 12C–14N (upper-left), 16O–23Na (upper-right), 24Mg–27Al (middle-left), and 24Mg–39K (middle-right). The lower middle and right panels represent the intersection of the parameter space reproducing the observed abundance patterns in light elements (middle) and in all the elements studied (right). Only a small region in temperature and time makes it possible to reproduce the light element patterns. At such temperature and time, 39K can not be enhanced, so a second set of temperature and time values are needed.
Current usage metrics show cumulative count of Article Views (full-text article views including HTML views, PDF and ePub downloads, according to the available data) and Abstracts Views on Vision4Press platform.
Data correspond to usage on the plateform after 2015. The current usage metrics is available 48-96 hours after online publication and is updated daily on week days.
Initial download of the metrics may take a while.