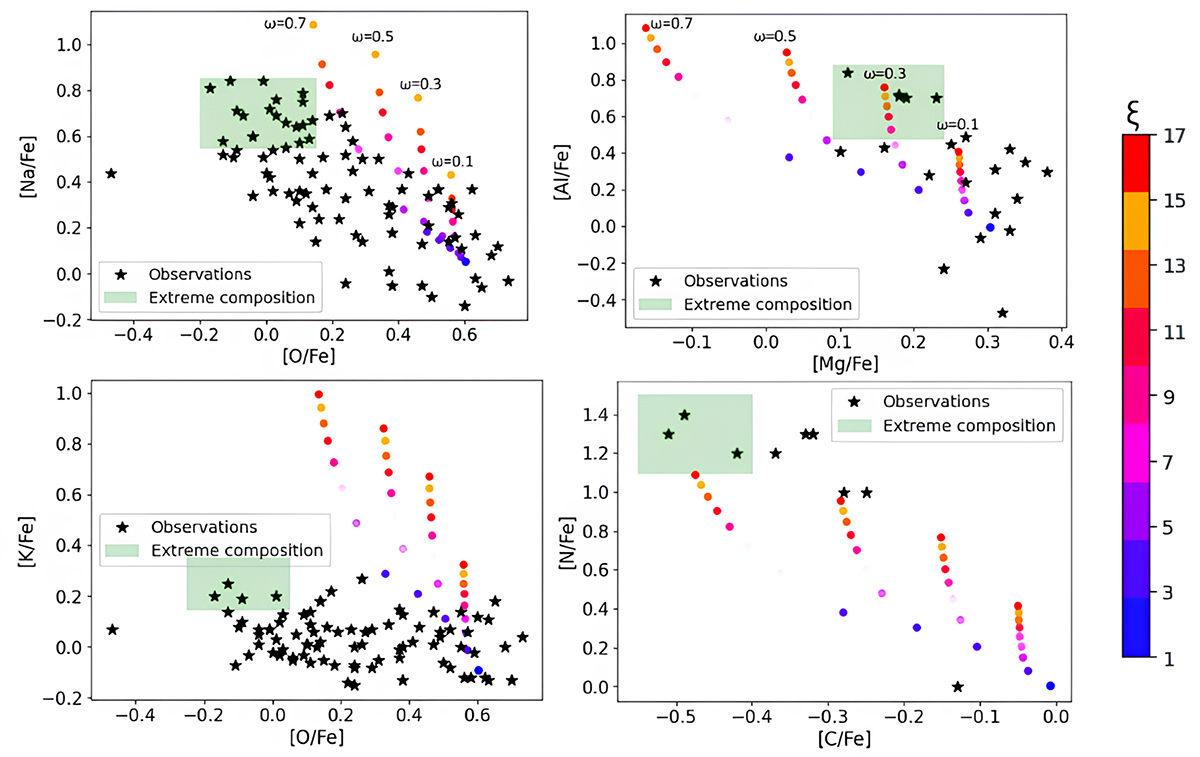
Fig. 2.
Download original image
Chemical abundance of O versus Na (upper-left), Mg versus Al (upper-right), O versus K (lower-left), and C versus N (lower-right). Black stars represent the observations taken from Carretta et al. (2005) for C and N, from Carretta et al. (2007) for O and Na, from Gruyters et al. (2014) for Al and Mg, and from Mucciarelli et al. (2017) for K. The green rectangle indicates the location of the most extreme abundances. The colored circles representing the abundances obtained using the reaction network (T = 80 MK and ρ = 1000 g cm−3) and the dilution model introduced in Eq. (8) with ω = 0.1, 0.3, 0.5, and 0.7 are colored according to the enrichment level parameterized by the parameter ξ. While the extreme potassium abundances require only a small ξ, other chemical elements like oxygen require a large mixing weight and enrichment level to reproduce the extreme population.
Current usage metrics show cumulative count of Article Views (full-text article views including HTML views, PDF and ePub downloads, according to the available data) and Abstracts Views on Vision4Press platform.
Data correspond to usage on the plateform after 2015. The current usage metrics is available 48-96 hours after online publication and is updated daily on week days.
Initial download of the metrics may take a while.