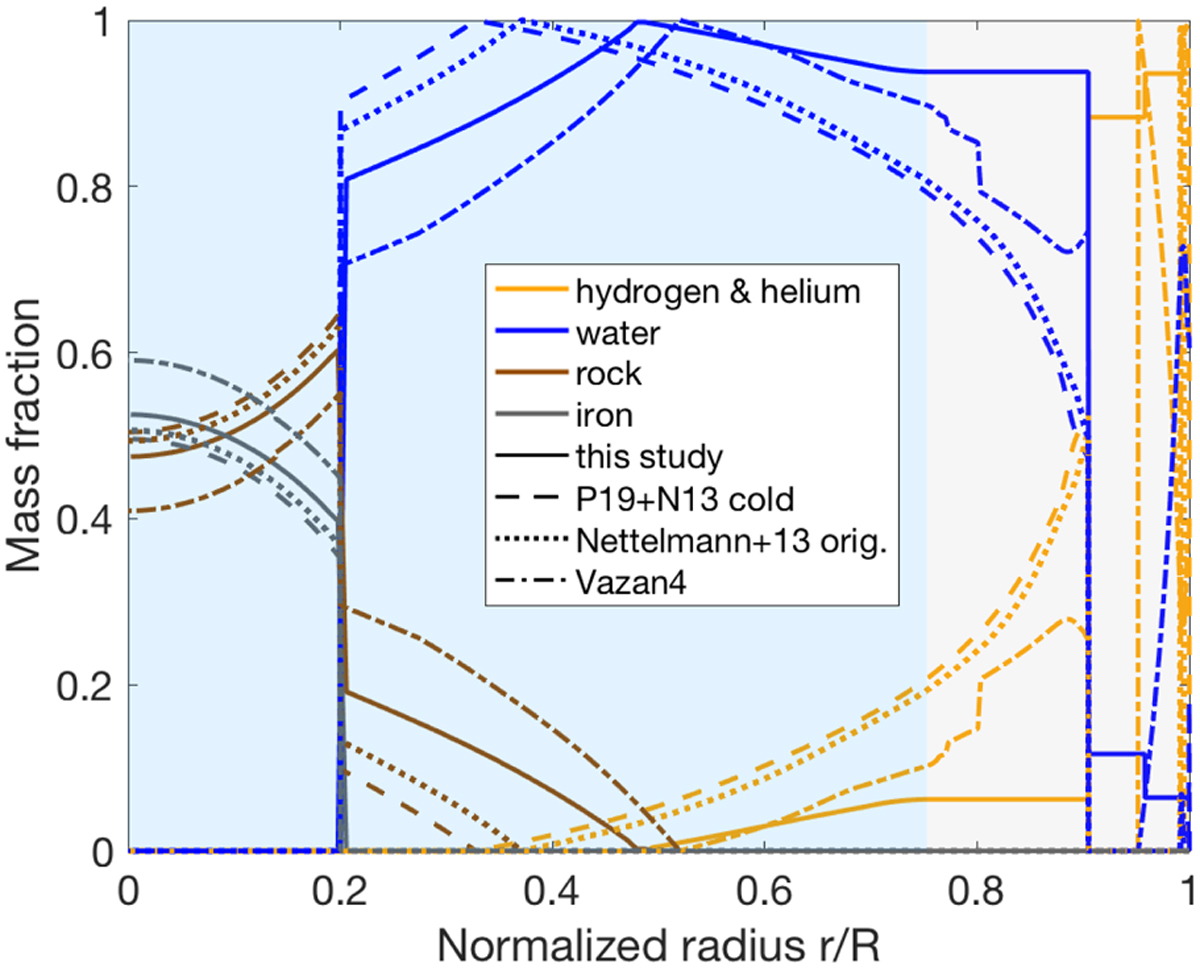
Fig. 5
Download original image
Mass fractions of a dense core model evaluated with different temperature profiles. The yellow curves mark the mass fraction of the protosolar H–He mixture. The blue, brown, and gray curves mark the heavy-element mass fraction of water, rock, and iron, respectively. The solid lines mark the mass fractions as evaluated by our method. Mass fractions obtained with the adiabatic temperature profiles P19+N13 cold and Nettelmann+13 orig. are shown with dashed and dotted curves, respectively. Finally, the mass fractions based on the non-adiabatic temperature of Vazan4 are presented with dash-dotted curves. The gray and blue shaded area indicates the convective and non-convective regions, respectively, as identified by our algorithm.
Current usage metrics show cumulative count of Article Views (full-text article views including HTML views, PDF and ePub downloads, according to the available data) and Abstracts Views on Vision4Press platform.
Data correspond to usage on the plateform after 2015. The current usage metrics is available 48-96 hours after online publication and is updated daily on week days.
Initial download of the metrics may take a while.