Fig. 3
Download original image
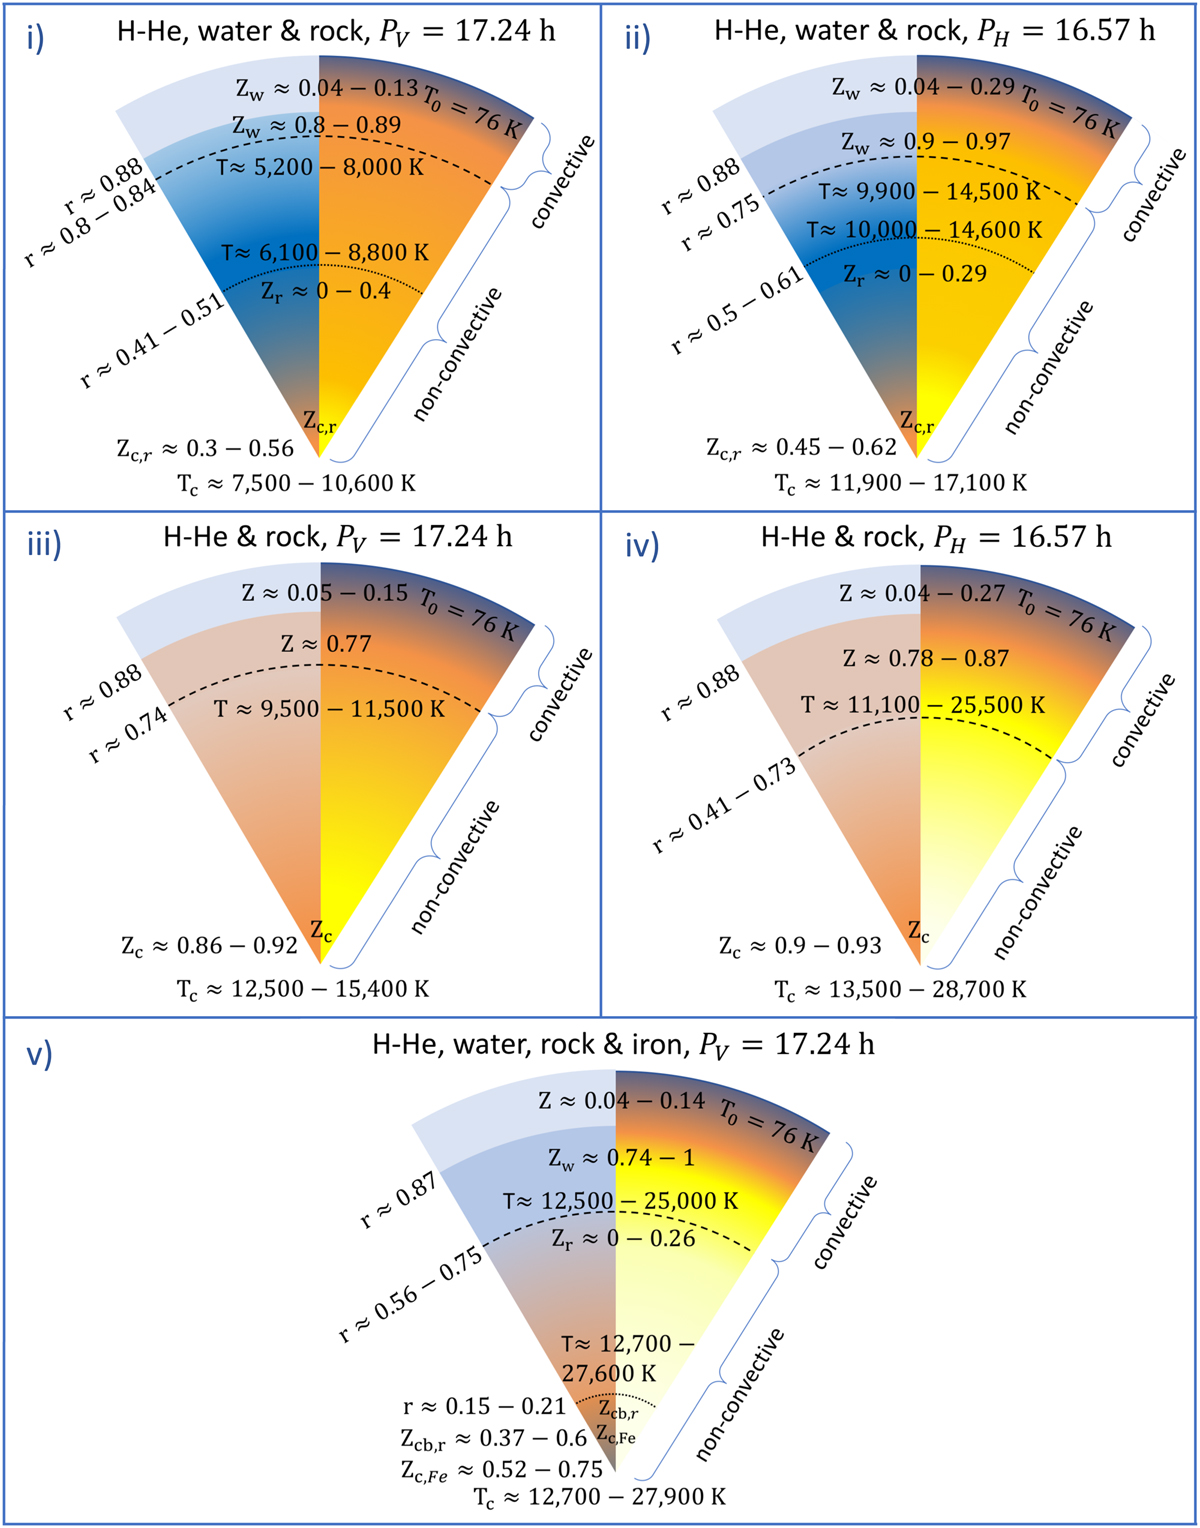
Sketches of Uranus’s interior structure. The left side of each panel shows the composition, and the right side illustrates the temperature. Cold regions are colored in blue, hot regions in yellow. The protosolar H–He mixture is colored in light blue, water in dark blue, rock in orange, and iron (bottom panel) in gray. Composition gradients are illustrated by a color gradient of the two mixed materials. The dashed curve marks the boundary between the convective and non-convective regions. Mass fractions of water, rock, and iron are indicated with Zw, Zr, and ZFe. The subscript “c” stands for “central” and “cb” for “core boundary.” Panel (i) represents Uranus with Pv, while panel (ii) corresponds to Uranus with PH. Panels (iii) and (iv) illustrate Uranus’s interior structure with pure rock as the heavy element, based on different rotation periods: Pv in panel (iii) or PH in panel (iv). Panel (v) represents Uranus with a high density core.
Current usage metrics show cumulative count of Article Views (full-text article views including HTML views, PDF and ePub downloads, according to the available data) and Abstracts Views on Vision4Press platform.
Data correspond to usage on the plateform after 2015. The current usage metrics is available 48-96 hours after online publication and is updated daily on week days.
Initial download of the metrics may take a while.