Fig. 2
Download original image
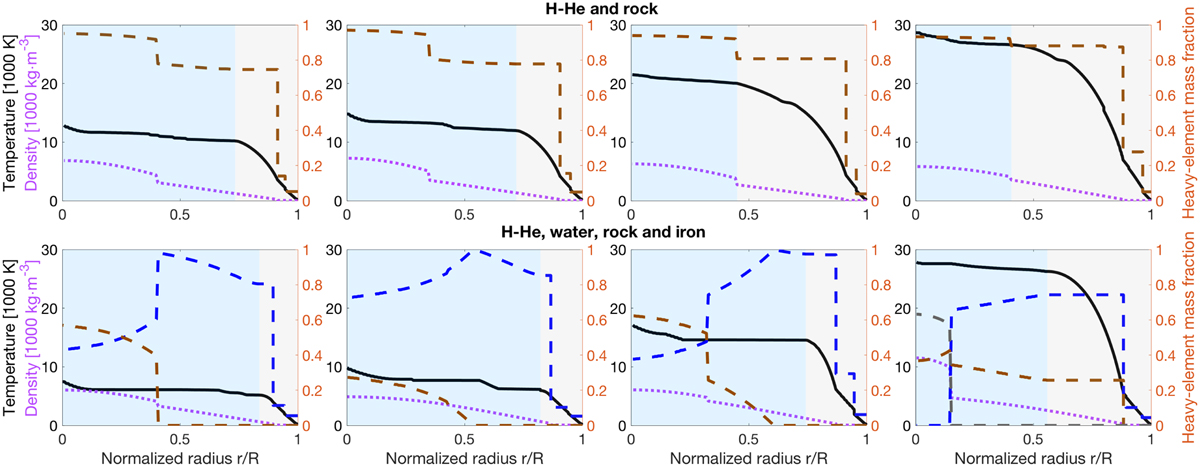
Temperature profiles (solid black curve), heavy-element mass fractions (dashed curves), and density profiles (dotted purple curve) of various solutions. In the upper row, the heavy elements are represented by pure rock (dashed brown line) only. The lower row shows more “physical” solutions in which the heavy elements are represented by water (dashed blue curve), rock (dashed brown curve), and, if necessary, iron (dashed gray curve). The gray-shaded radial area marks the convective regions. On the other hand, the blue-shaded radial area marks the non-convective and nonhomogeneous region. The dashed blue, brown, and gray lines show the radial mass fraction of water, rock, and iron, respectively.
Current usage metrics show cumulative count of Article Views (full-text article views including HTML views, PDF and ePub downloads, according to the available data) and Abstracts Views on Vision4Press platform.
Data correspond to usage on the plateform after 2015. The current usage metrics is available 48-96 hours after online publication and is updated daily on week days.
Initial download of the metrics may take a while.