Fig. 1
Download original image
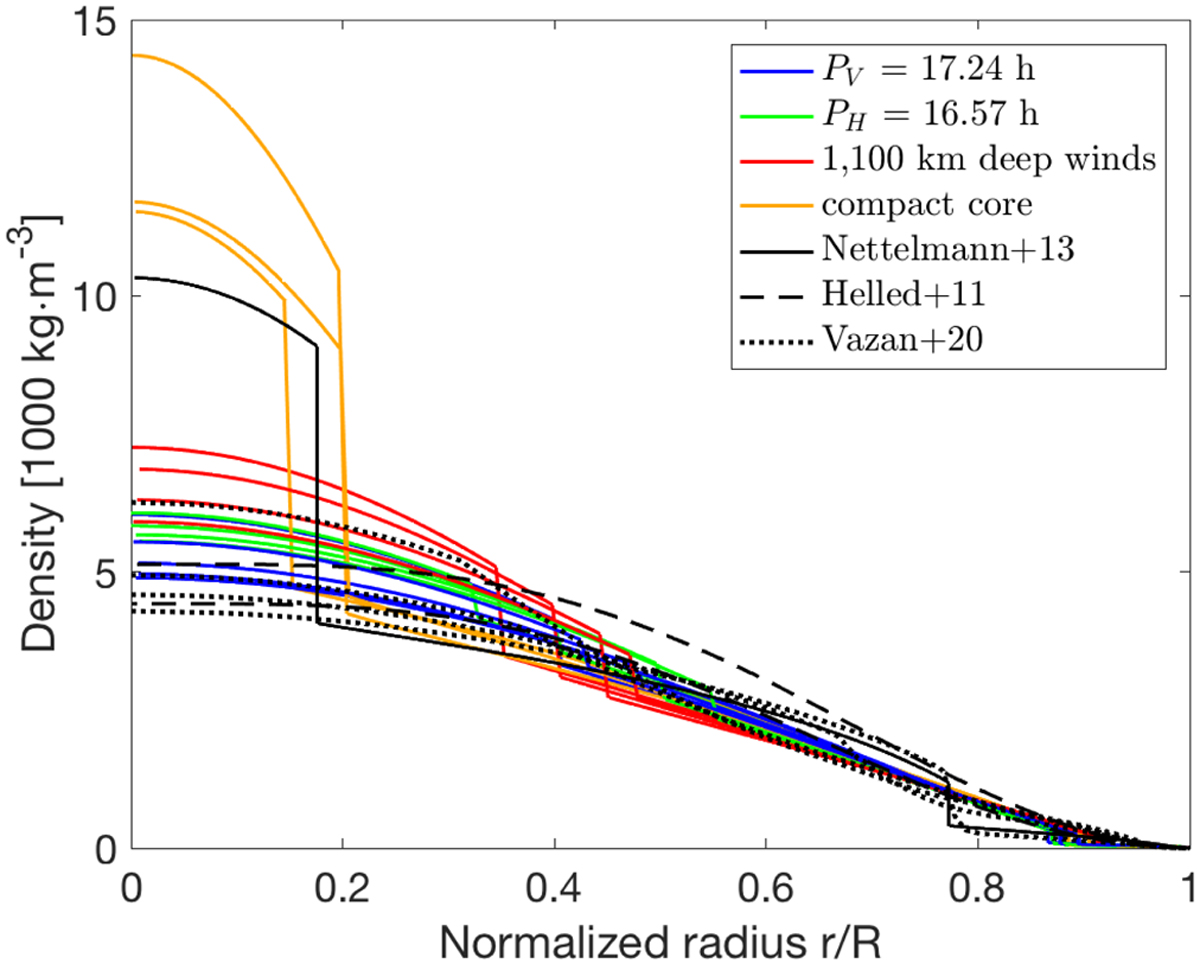
Empirical density profiles from Neuenschwander & Helled (2022) we considered in this study. Also shown are published density profiles of Uranus. The blue curves show Uranus models that use the rotation period estimated by the Voyager 2 mission, while the green curves show models that use the rotation period proposed by Helled et al. (2010). The red curves show models with 1100 km deep winds, and the yellow curves correspond to solutions with high central densities.
Current usage metrics show cumulative count of Article Views (full-text article views including HTML views, PDF and ePub downloads, according to the available data) and Abstracts Views on Vision4Press platform.
Data correspond to usage on the plateform after 2015. The current usage metrics is available 48-96 hours after online publication and is updated daily on week days.
Initial download of the metrics may take a while.