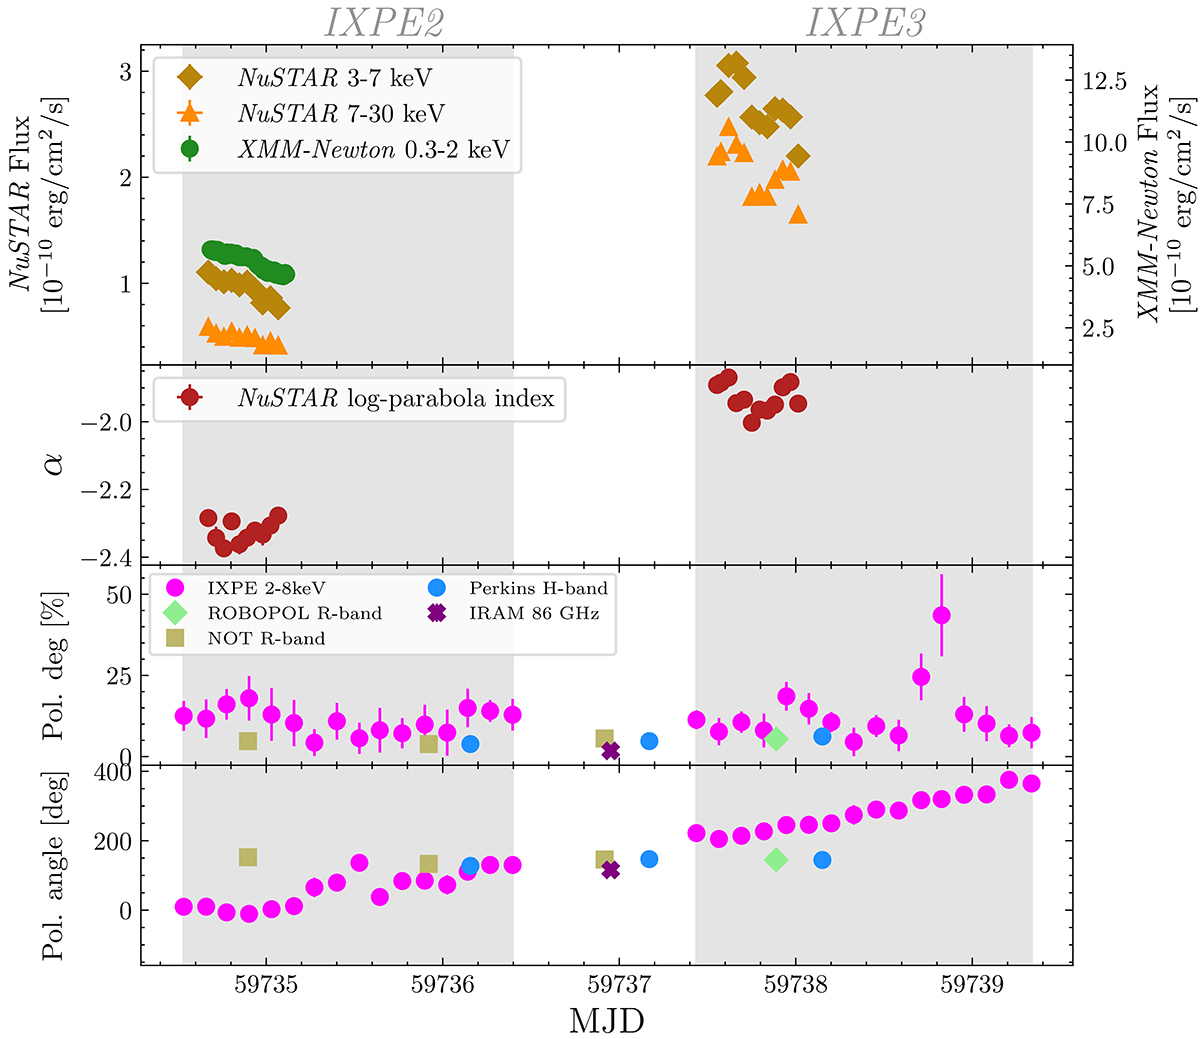
Fig. 7.
Download original image
Zoomed-in view of the NuSTAR light curves in the 3–7 keV and 7–30 keV bands during the IXPE 2 and IXPE 3 epochs. The top panel report the fluxes in 1 h bins. The second panel from the top is the α index evolution derived from fits of the NuSTAR spectra. The last two panels show the simultaneous polarization degree and polarization angle in the X-ray band (IXPE), optical and radio bands.
Current usage metrics show cumulative count of Article Views (full-text article views including HTML views, PDF and ePub downloads, according to the available data) and Abstracts Views on Vision4Press platform.
Data correspond to usage on the plateform after 2015. The current usage metrics is available 48-96 hours after online publication and is updated daily on week days.
Initial download of the metrics may take a while.