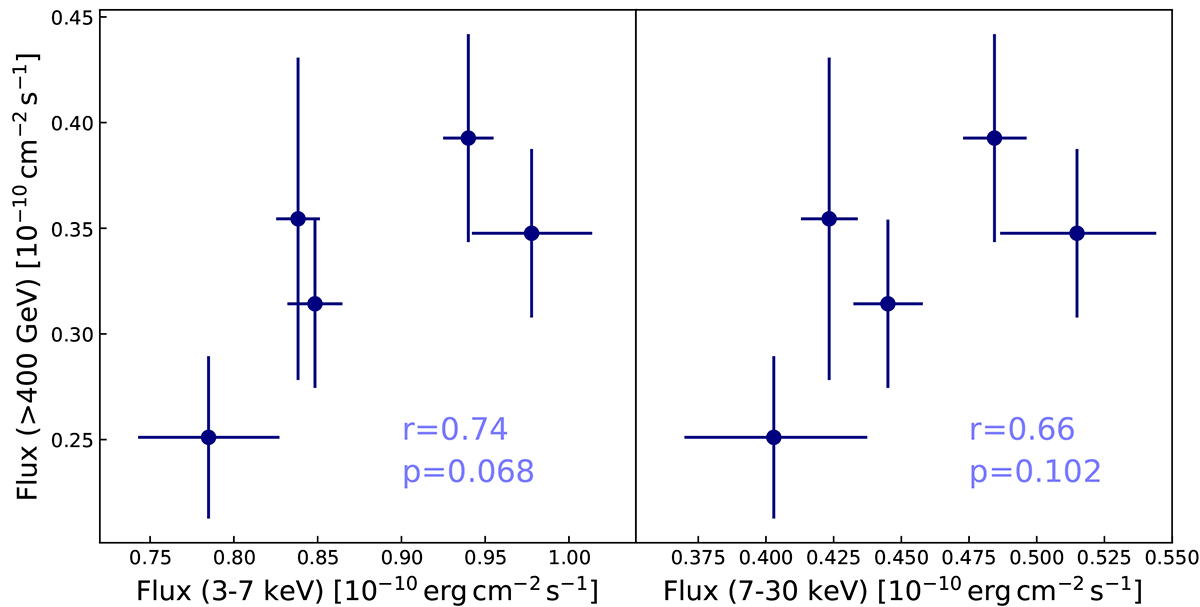
Fig. 6.
Download original image
MAGIC flux versus NuSTAR flux and quantification of the correlation during the IXPE 2 epoch. The MAGIC flux is computed above 400 GeV while the X-ray flux is evaluated in two different energy bands: 3–7 keV for the left panel and 7–30 keV for the right panel. In each panel, the obtained Pearson’s r coefficient is indicated. We specify below the p-value that describes the probability of obtaining the observed r coefficient for two uncorrelated light curves. This p-value was estimated based on Monte Carlo toy simulations (see the main text for more details).
Current usage metrics show cumulative count of Article Views (full-text article views including HTML views, PDF and ePub downloads, according to the available data) and Abstracts Views on Vision4Press platform.
Data correspond to usage on the plateform after 2015. The current usage metrics is available 48-96 hours after online publication and is updated daily on week days.
Initial download of the metrics may take a while.