Fig. 5.
Download original image
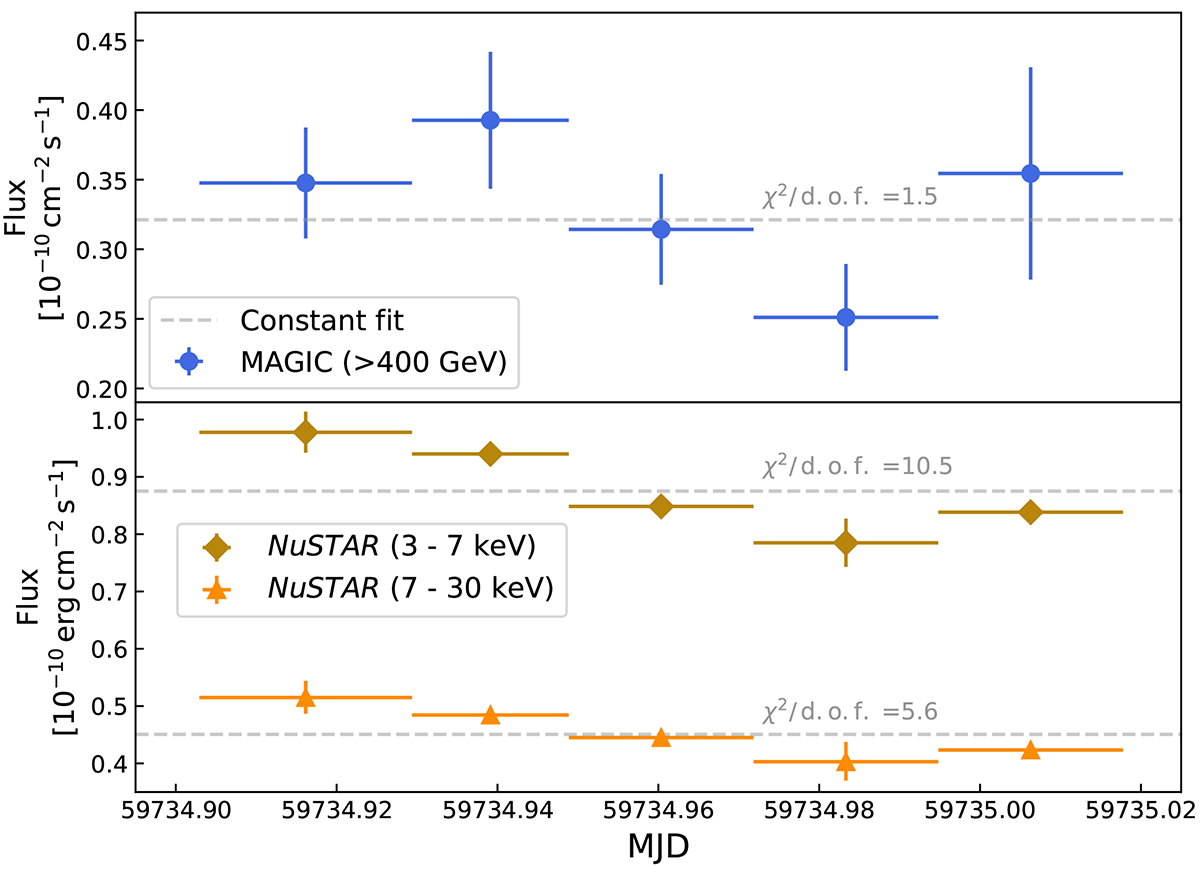
MAGIC and NuSTAR intra-night light curve between June 4, 2022 (MJD 59734) and June 5, 2022 (MJD 59735), corresponding to the IXPE 2 epoch. Upper panel: Light curve above 400 GeV obtained with MAGIC. A constant model fit is showed in dashed gray with the corresponding reduced χ2. Lower panel: Light curves for the 3–7 keV and the 7–30 keV band taken by NuSTAR, and constant fits for both. Fluxes from both instruments are computed in ≈30 min time bins, except for the first bin that is ≈40 min long due to a limited exposure of NuSTAR around at the start of the MAGIC observation.
Current usage metrics show cumulative count of Article Views (full-text article views including HTML views, PDF and ePub downloads, according to the available data) and Abstracts Views on Vision4Press platform.
Data correspond to usage on the plateform after 2015. The current usage metrics is available 48-96 hours after online publication and is updated daily on week days.
Initial download of the metrics may take a while.