Fig. C.4.
Download original image
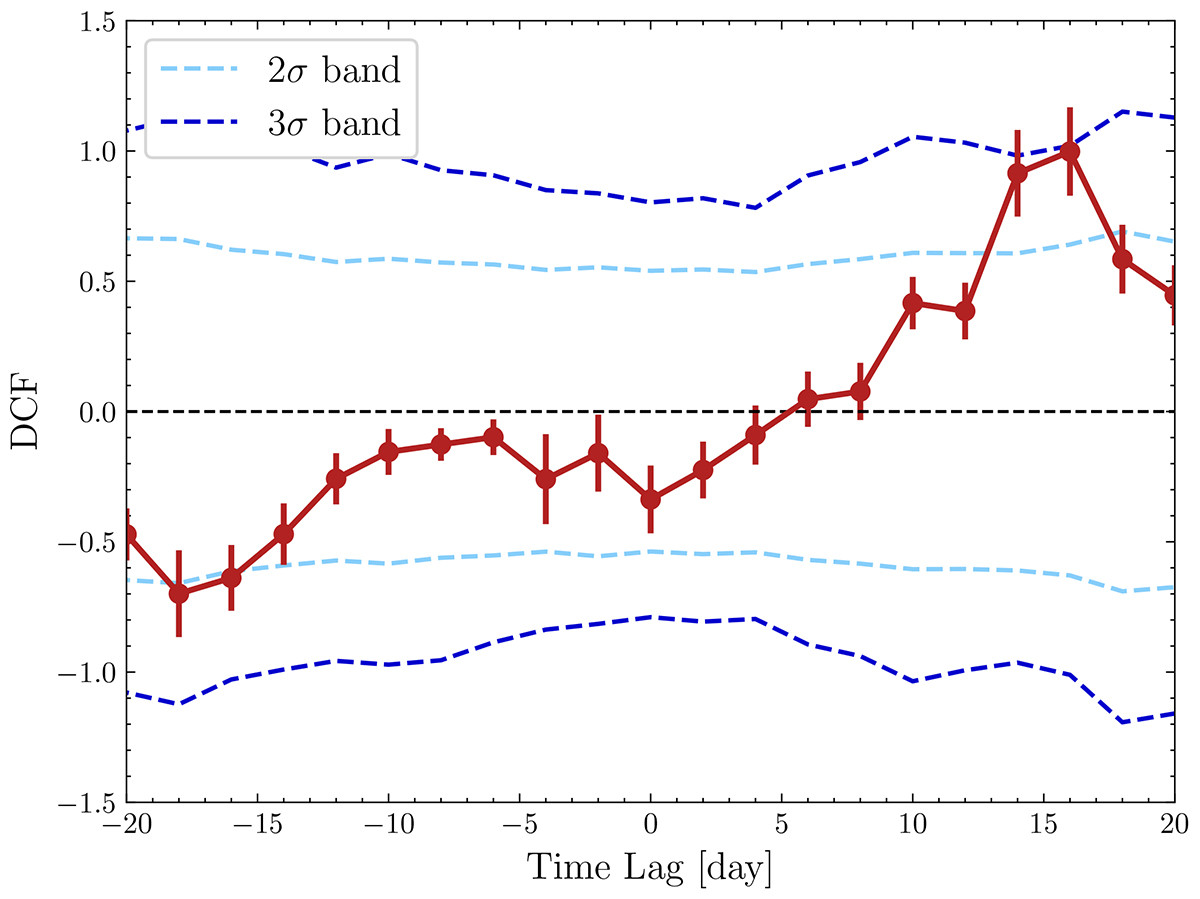
DCF computed for the Swift-UVOT W1 and Swift-XRT 2-10 keV light curves over the full campaign, between MJD 59695 (April 26, 2022) to MJD 59760 (June 30, 2022), with a time-lag binning of 2 days. The red points are the obtained DCF values and their uncertainties. The light blue and dark blue dashed lines show the 2σ and 3σ significance bands, respectively (see the main text for more details).
Current usage metrics show cumulative count of Article Views (full-text article views including HTML views, PDF and ePub downloads, according to the available data) and Abstracts Views on Vision4Press platform.
Data correspond to usage on the plateform after 2015. The current usage metrics is available 48-96 hours after online publication and is updated daily on week days.
Initial download of the metrics may take a while.