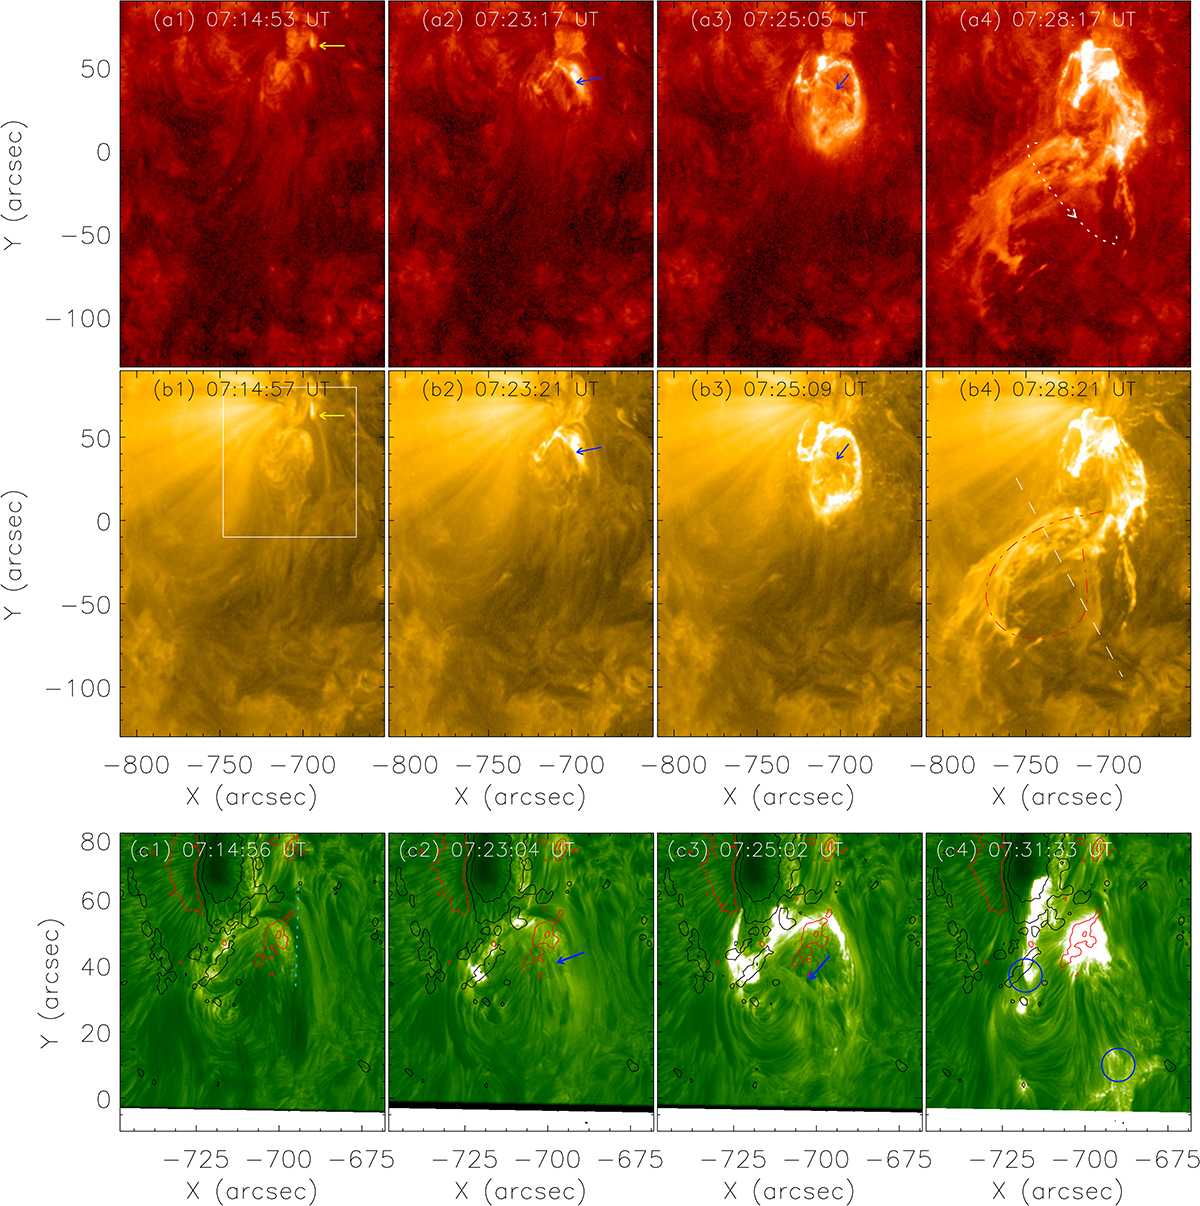
Fig. 8.
Download original image
Process of the filament eruption. (a1)–(a4): SDO/AIA 304 Å observations. (b1)–(b4): SDO/AIA 171 observations. The white box outlines the field of view of panels c1–c4. (c1)–(c4): NVST Hα observations. The blue arrows point out the erupting filament. The red and black contours indicate the positive and negative magnetic field with levels of ±100 G. The blue circles mark the brightenings associated with the footpoints of the inverted U-shaped filament. An animation available online shows the eruption process of the filament in 304 Å, and 171 Å wavelengths during the period from 07:12 UT to 07:52 UT.
Current usage metrics show cumulative count of Article Views (full-text article views including HTML views, PDF and ePub downloads, according to the available data) and Abstracts Views on Vision4Press platform.
Data correspond to usage on the plateform after 2015. The current usage metrics is available 48-96 hours after online publication and is updated daily on week days.
Initial download of the metrics may take a while.