Fig. 6.
Download original image
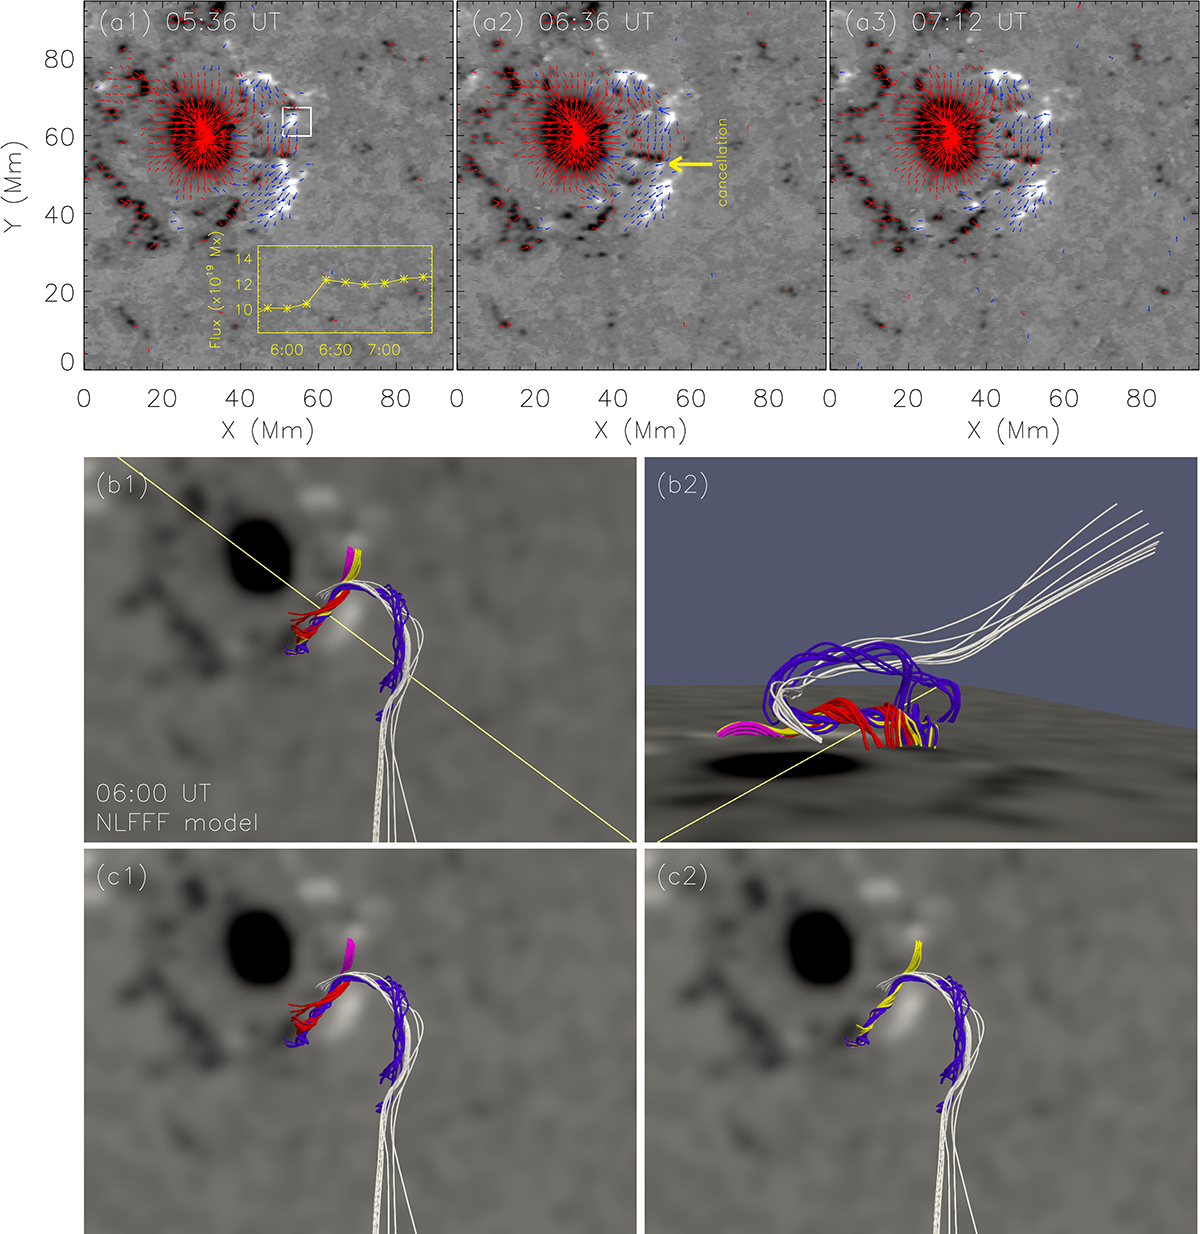
Magnetic structures associated with two jet-like activities. (a1)–(a3): vector magnetograms. The blue and red arrows denote the transverse magnetic field with positive and negative vertical magnetic fields, respectively. The yellow box in panel a1 shows the variation in the positive magnetic flux in the white box of panel a. (b1)–(b2) and (c1)–(c2): magnetic field lines derived by the NLFFF extrapolation at 06:00 UT. Panels b1, c1, and c2 are a top view, while panel b2 is a side view. An animation available online shows the evolution of vector magnetograms during the period from 04:00 UT to 07:48 UT.
Current usage metrics show cumulative count of Article Views (full-text article views including HTML views, PDF and ePub downloads, according to the available data) and Abstracts Views on Vision4Press platform.
Data correspond to usage on the plateform after 2015. The current usage metrics is available 48-96 hours after online publication and is updated daily on week days.
Initial download of the metrics may take a while.