Fig. 5.
Download original image
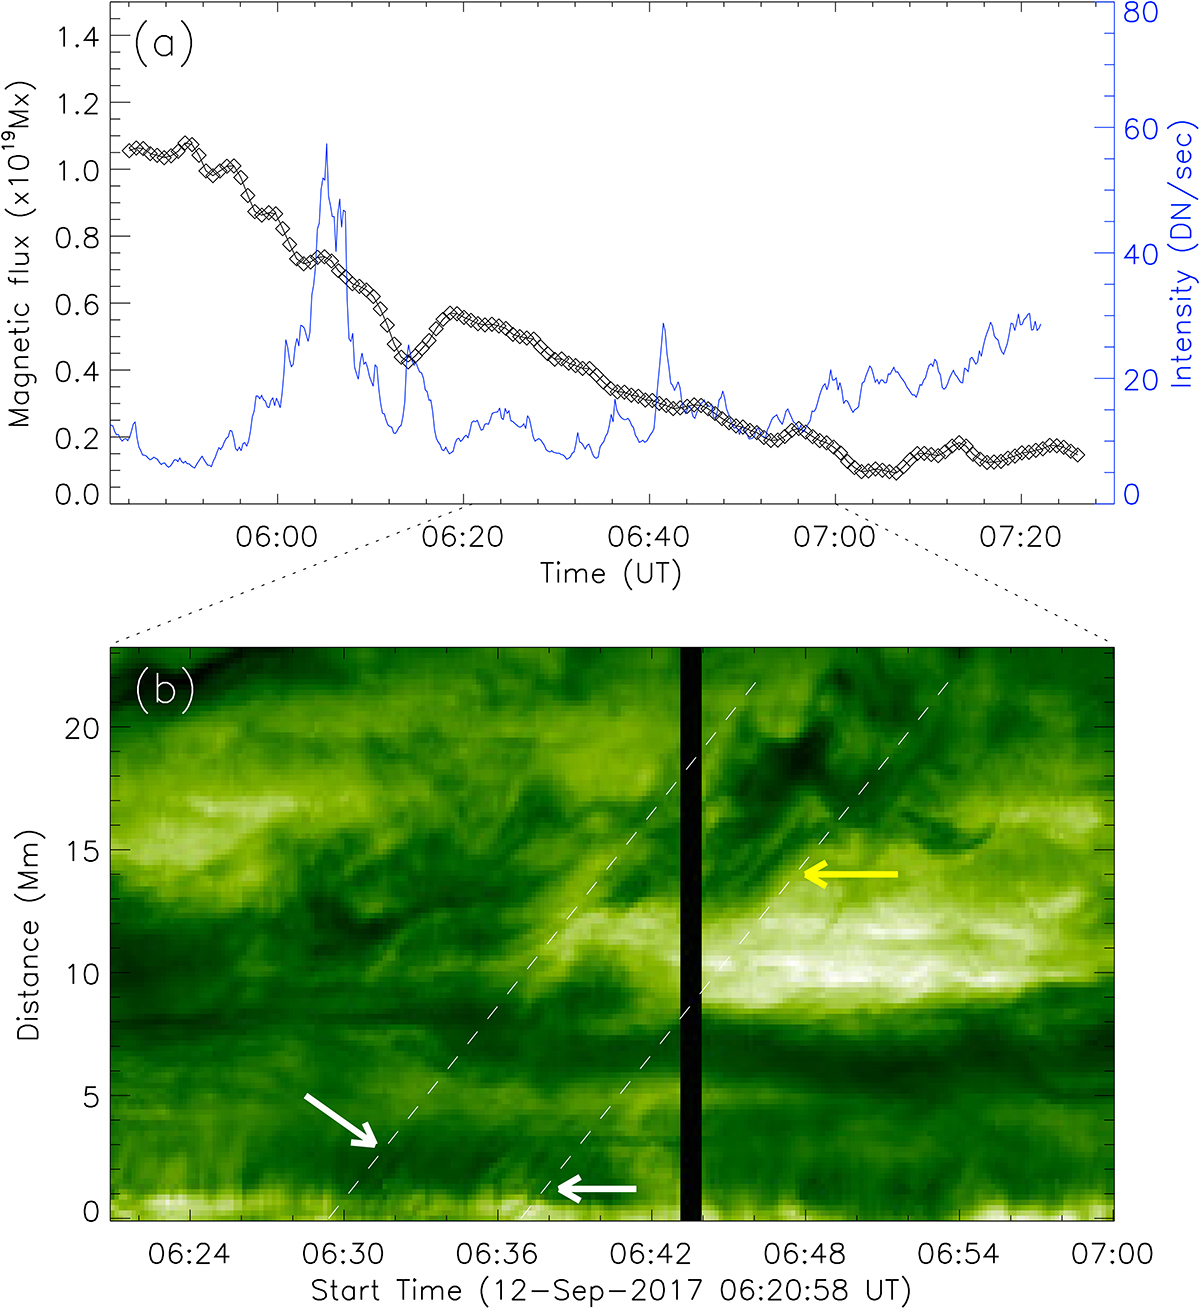
Variations in some parameters. (a): variations in the positive magnetic flux in the black box of Figs. 1c2 and 2a1 and in the SDO/AIA 304 Å mean intensities in the box of Fig. 2b2. The mean intensities are normalized by the duration. (b): time-distance diagram derived from a series of NVST Hα images along the dashed line in Fig. 2a2.
Current usage metrics show cumulative count of Article Views (full-text article views including HTML views, PDF and ePub downloads, according to the available data) and Abstracts Views on Vision4Press platform.
Data correspond to usage on the plateform after 2015. The current usage metrics is available 48-96 hours after online publication and is updated daily on week days.
Initial download of the metrics may take a while.