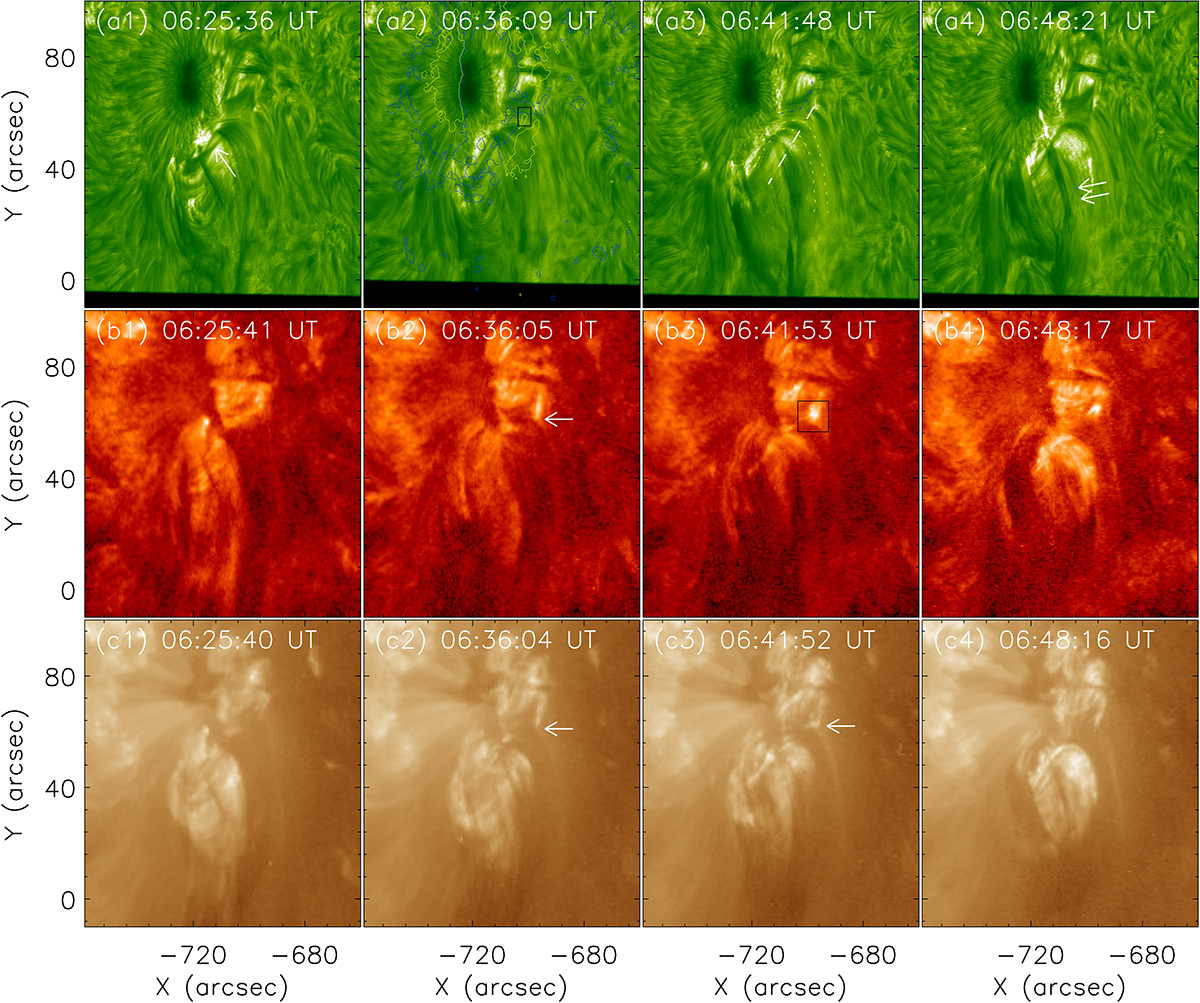
Fig. 3.
Download original image
Second jet-like activity. (a1)–(a4): Hα images observed by NVST. The yellow and blue contours in panel a1 indicate the positive and negative magnetic fields with levels of ±100 G, respectively. (b1)–(b4): 304 Å images observed by SDO/AIA. (c1)–(c4): 193 Å images observed by SDO/AIA. An animation available online shows the second jet-like activity in the 304 Å and 193 Å wavelengths during the period from 06:32 UT to 07:12 UT.
Current usage metrics show cumulative count of Article Views (full-text article views including HTML views, PDF and ePub downloads, according to the available data) and Abstracts Views on Vision4Press platform.
Data correspond to usage on the plateform after 2015. The current usage metrics is available 48-96 hours after online publication and is updated daily on week days.
Initial download of the metrics may take a while.