Open Access
Fig. 11.
Download original image
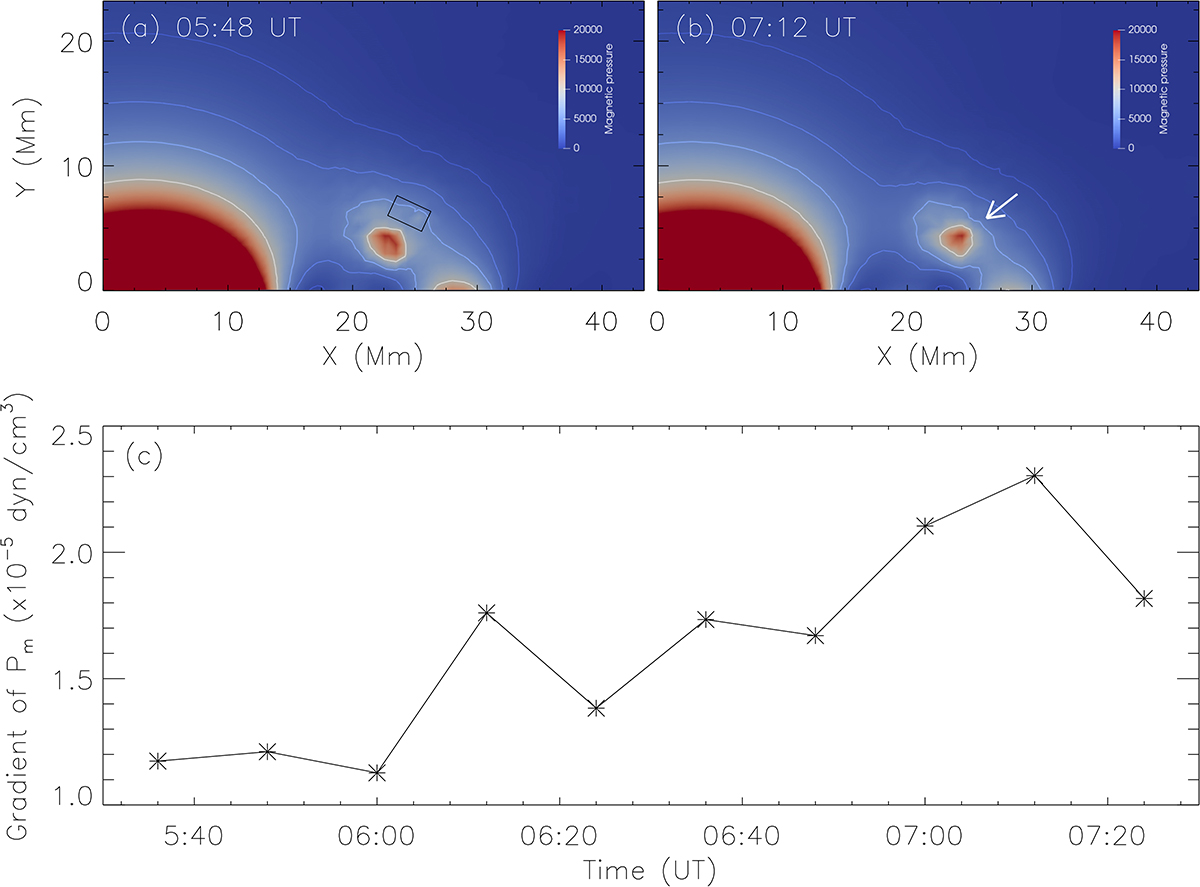
Distribution of the magnetic pressure in the white box of Fig. 9a. (a)–(b): magnetic pressure at 05:48 UT and 07:12 UT. The contours outline the magnetic pressure with levels of 1000, 2000, 5000, and 10 000 dyn/cm2. (c) Variation in the mean gradient of the magnetic pressure in the black box of panel a.
Current usage metrics show cumulative count of Article Views (full-text article views including HTML views, PDF and ePub downloads, according to the available data) and Abstracts Views on Vision4Press platform.
Data correspond to usage on the plateform after 2015. The current usage metrics is available 48-96 hours after online publication and is updated daily on week days.
Initial download of the metrics may take a while.