Fig. 10.
Download original image
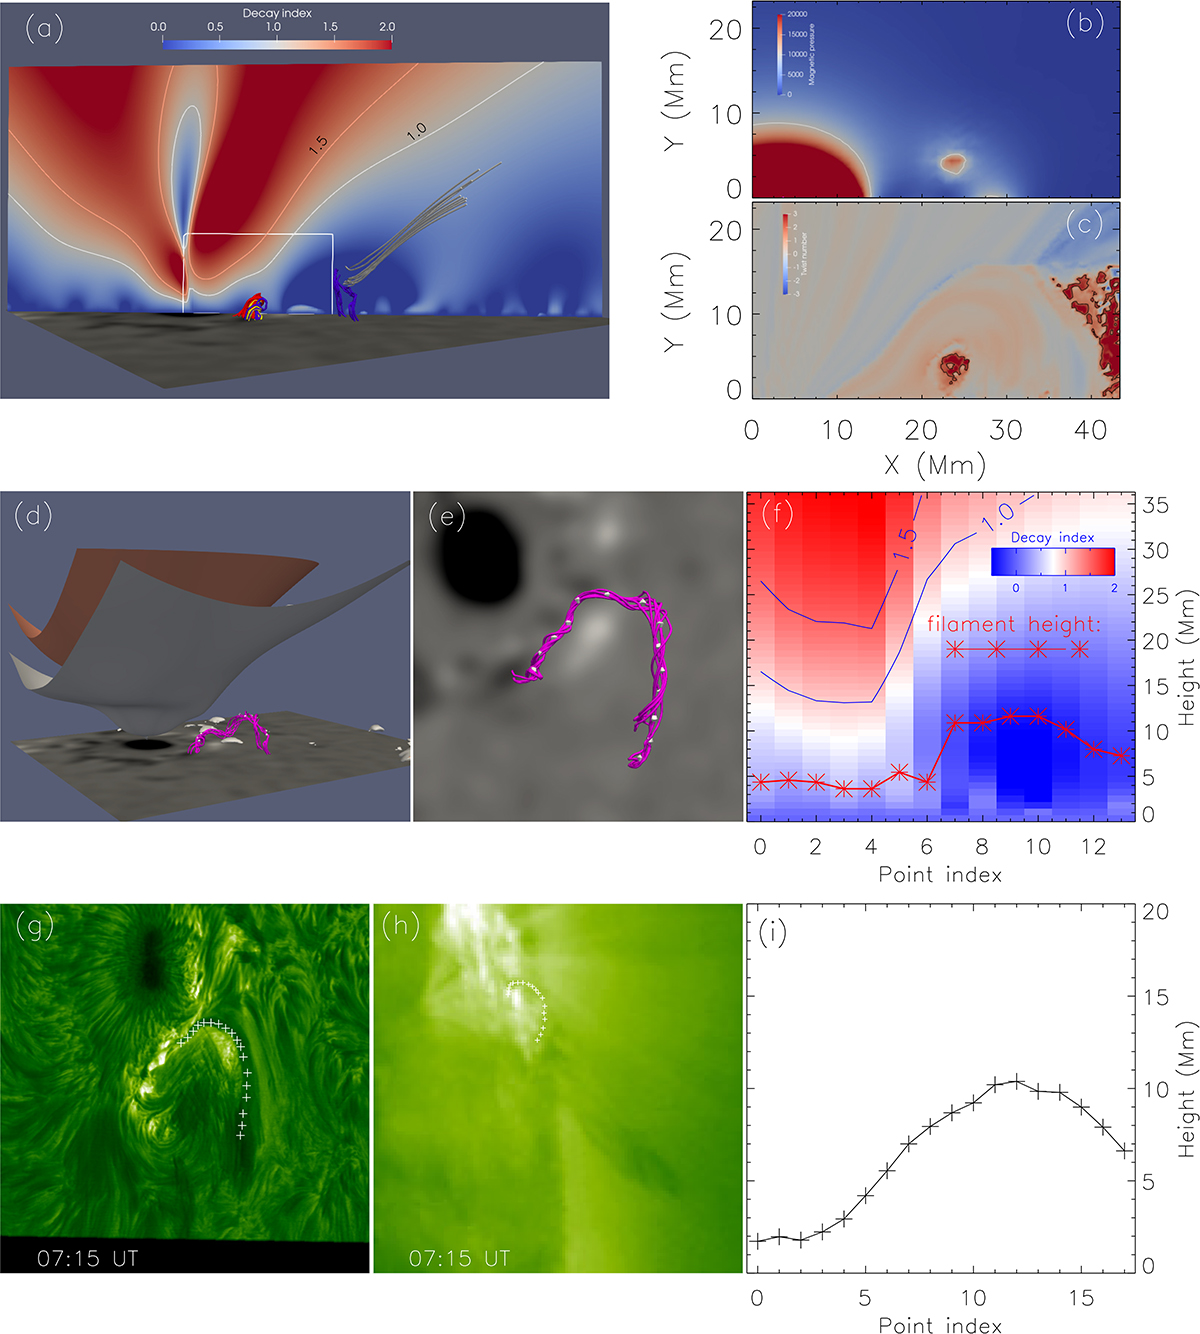
Magnetic properties before the filament eruption. (a): distribution of the decay index in the cross section, superimposing the selected magnetic field lines from Fig. 6. The cross section is perpendicular to the solar surface along the yellow line in Figs. 6b1 and b2. The contours indicate the decay index values of 1.5 and 1.0. The white rectangle box outlines the region of panels b and c. (b): distribution of magnetic pressure, with white contours denoting magnetic pressure at 10 000 dyn/cm−2 (∼500 Gauss). (c): twist number, with the black contour outlining the twist number of two turns. (d): selected magnetic field lines representing the inverted U-shaped filament and three-dimensional contours of the decay index at 1.5 and 1.0. (e): selected magnetic field lines representing the inverted U-shaped filament seen from a top view, overlapping with some selected white dots. The white dots in panels d and e mark the filament structure. (f): height of the filament marked by the white dots. The background shows the decay index with the height at the corresponding points. The contours represent decay index values of 1.5 and 1.0. (g): NVST Hα observaion at 07:15 UT. (h): corresponding STEREO-A 195 Å observaion. The white plus signs mark the same structure representing the filament seen from different views. (i): Height of the selected white plus signs.
Current usage metrics show cumulative count of Article Views (full-text article views including HTML views, PDF and ePub downloads, according to the available data) and Abstracts Views on Vision4Press platform.
Data correspond to usage on the plateform after 2015. The current usage metrics is available 48-96 hours after online publication and is updated daily on week days.
Initial download of the metrics may take a while.