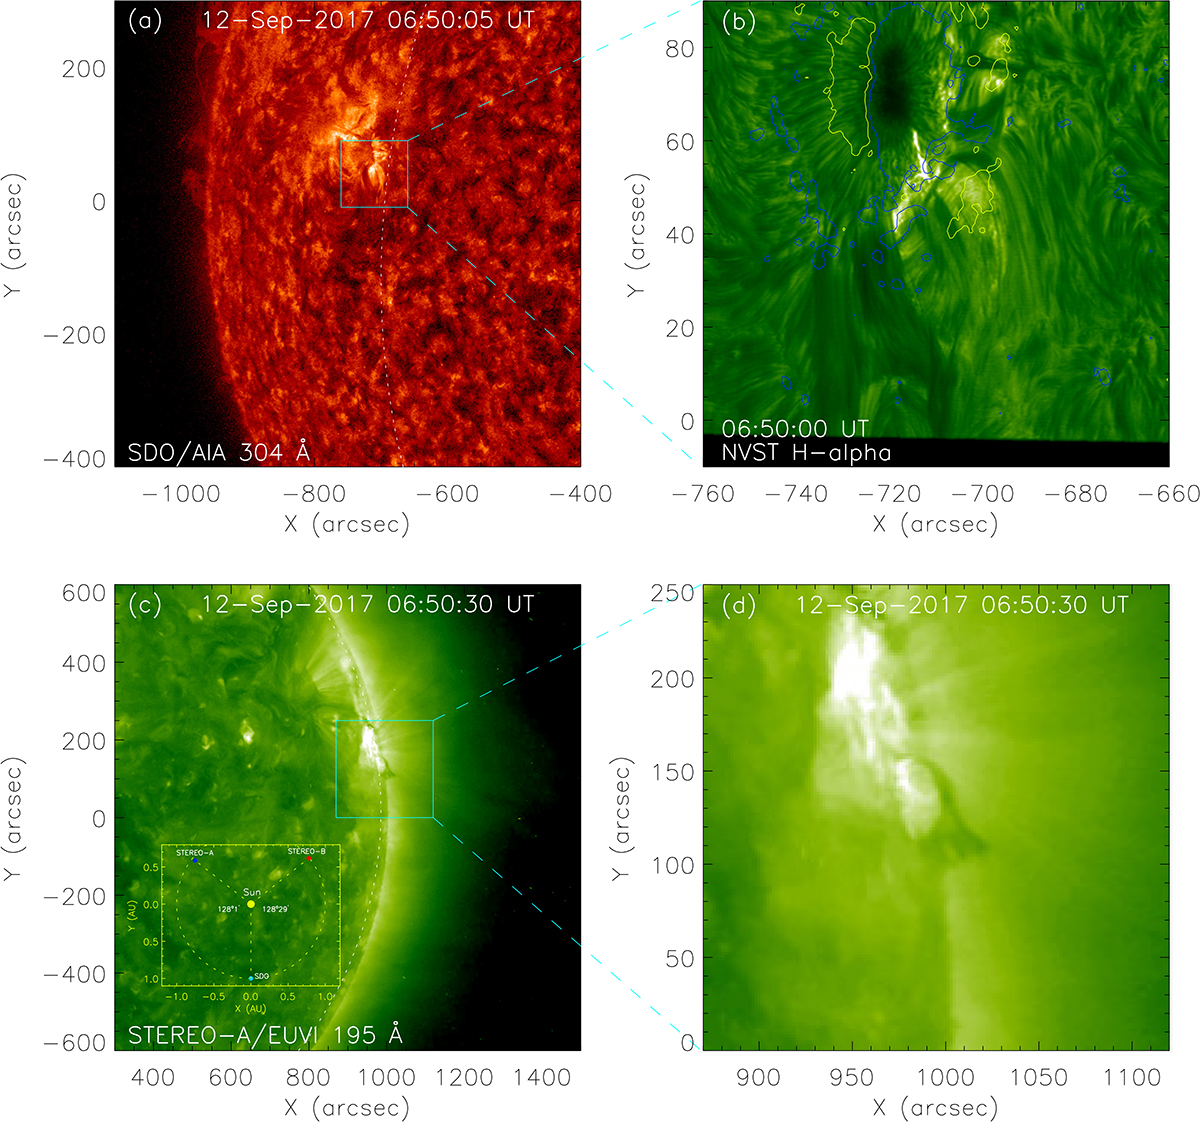
Fig. 1.
Download original image
Overview observations of the filament. (a): 304 Å image observed from SDO/AIA. The cyan box outlines the field of view of panel b. (b): Hα images observed from NVST. The yellow and blue contours indicate the positive and negative magnetic field with levels of ±100 G. (c): observations of STEREO-A/EUVI in 195 Å. The yellow box in the bottom left corner shows the relative locations of STEREO-A, STEREO-B, and SDO at 06:50 UT. The cyan box outlines the field of view of panel d. (d): zoomed-in region of panel c. The dotted white lines in panels a and c denote the same position on the Sun. An animation available online shows the observation of NVST Hα during the period from 06:20 UT to 08:00 UT.
Current usage metrics show cumulative count of Article Views (full-text article views including HTML views, PDF and ePub downloads, according to the available data) and Abstracts Views on Vision4Press platform.
Data correspond to usage on the plateform after 2015. The current usage metrics is available 48-96 hours after online publication and is updated daily on week days.
Initial download of the metrics may take a while.