Fig. 7.
Download original image
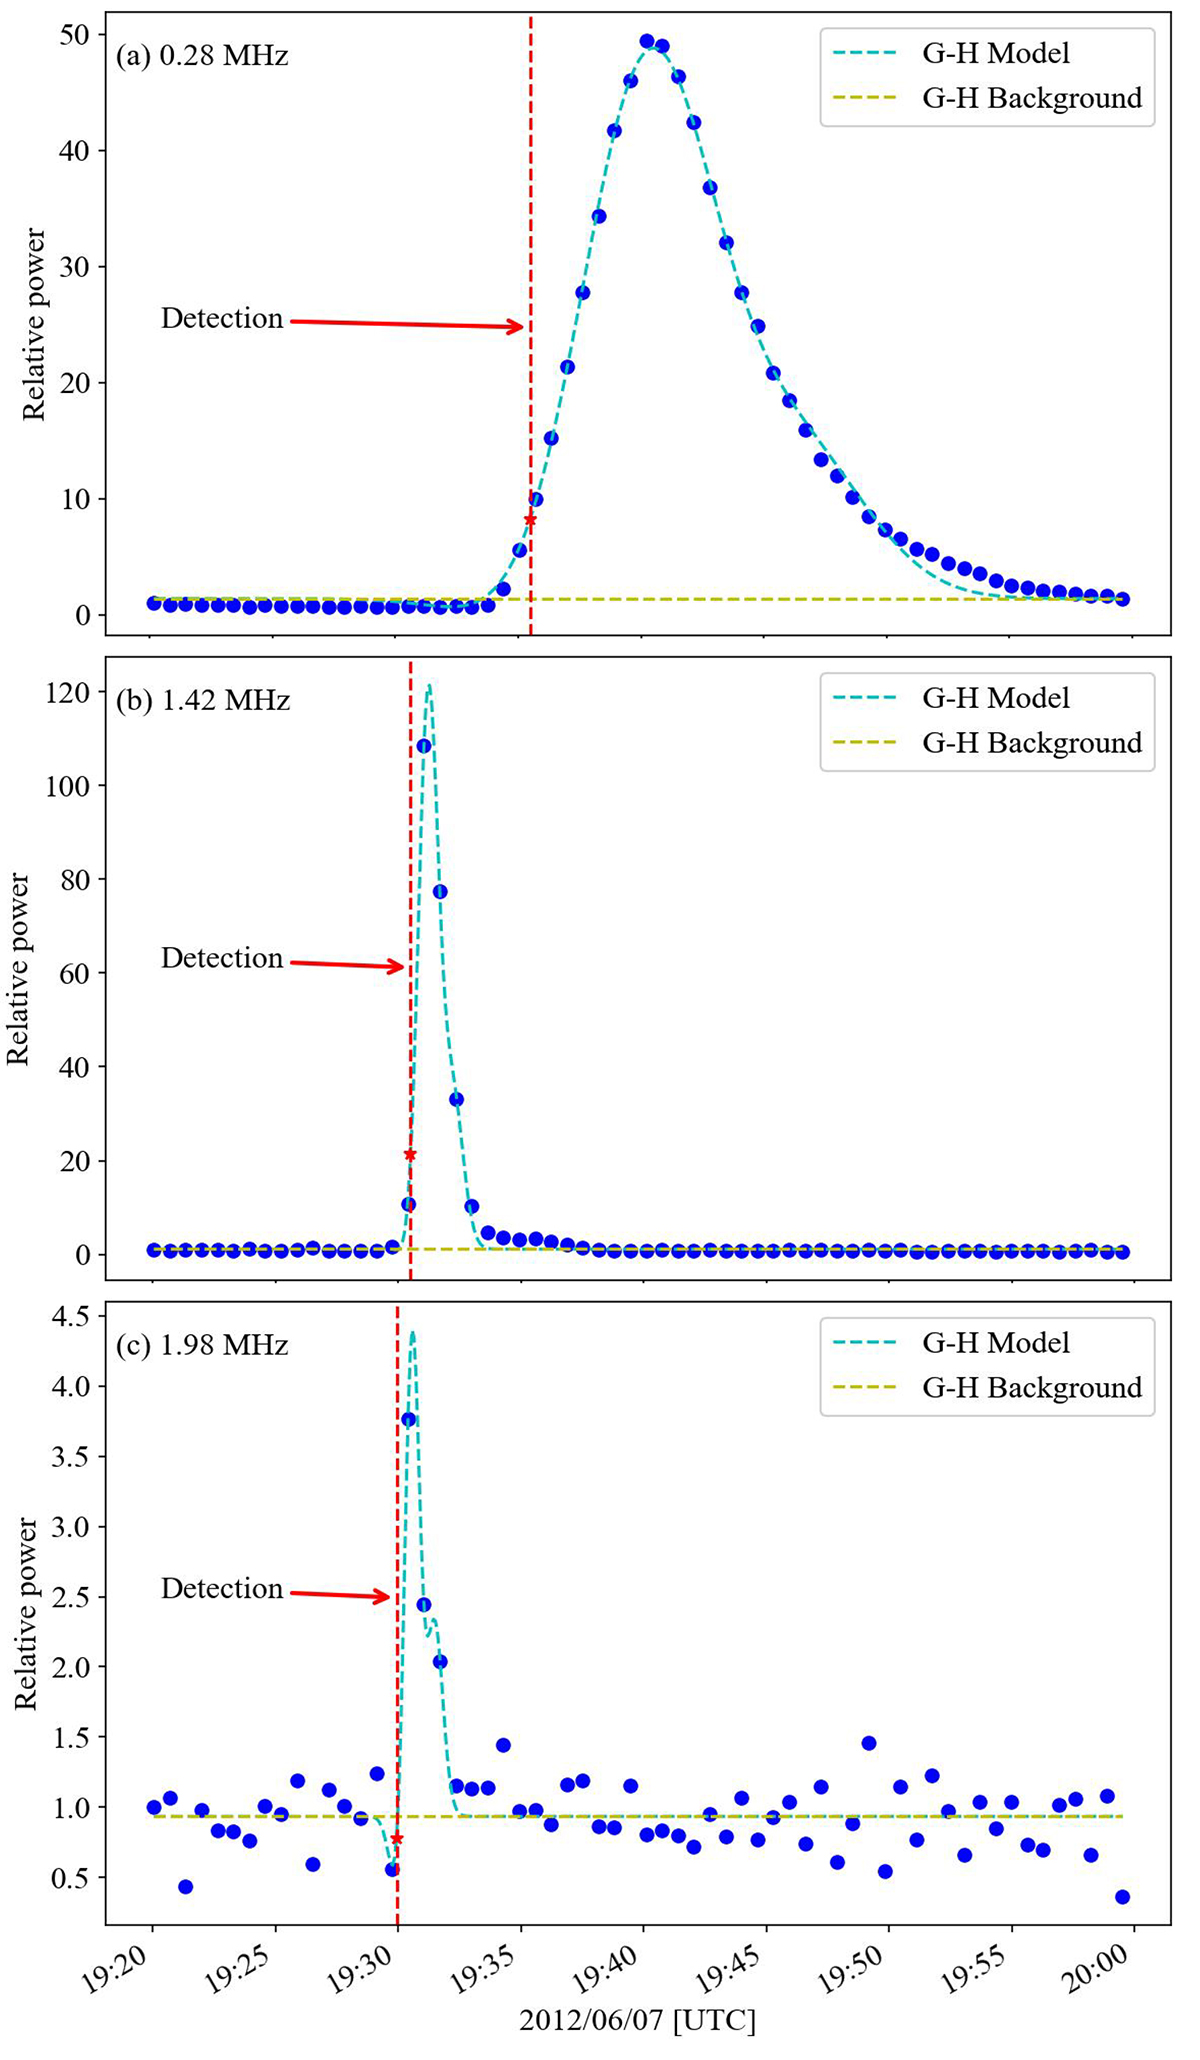
Edge detection from the GH Type III detection algorithm. Blue dots show the light curve data, the yellow dashed line shows the background level derived from the GH Type III fitter, the cyan dashed line shows the GH fitting, and the red star and dashed line show the detection point used to obtain the rise time of the burst. a) Example of a high S/N light curve fit using GH polynomials. b) Example of a fit with a low signal data count. The low data count had no noticeable effect on the performance of the algorithm to obtain the rise time of the light curve. c) Example of a light curve with a poor S/N. The GH algorithm was capable of fitting a Type III light curve profile despite the poor S/N. The detection was observed to be on the order of one cadence from the rise time location based on visual confirmation of the data points in the dynamic spectra plot in Fig. 5.
Current usage metrics show cumulative count of Article Views (full-text article views including HTML views, PDF and ePub downloads, according to the available data) and Abstracts Views on Vision4Press platform.
Data correspond to usage on the plateform after 2015. The current usage metrics is available 48-96 hours after online publication and is updated daily on week days.
Initial download of the metrics may take a while.