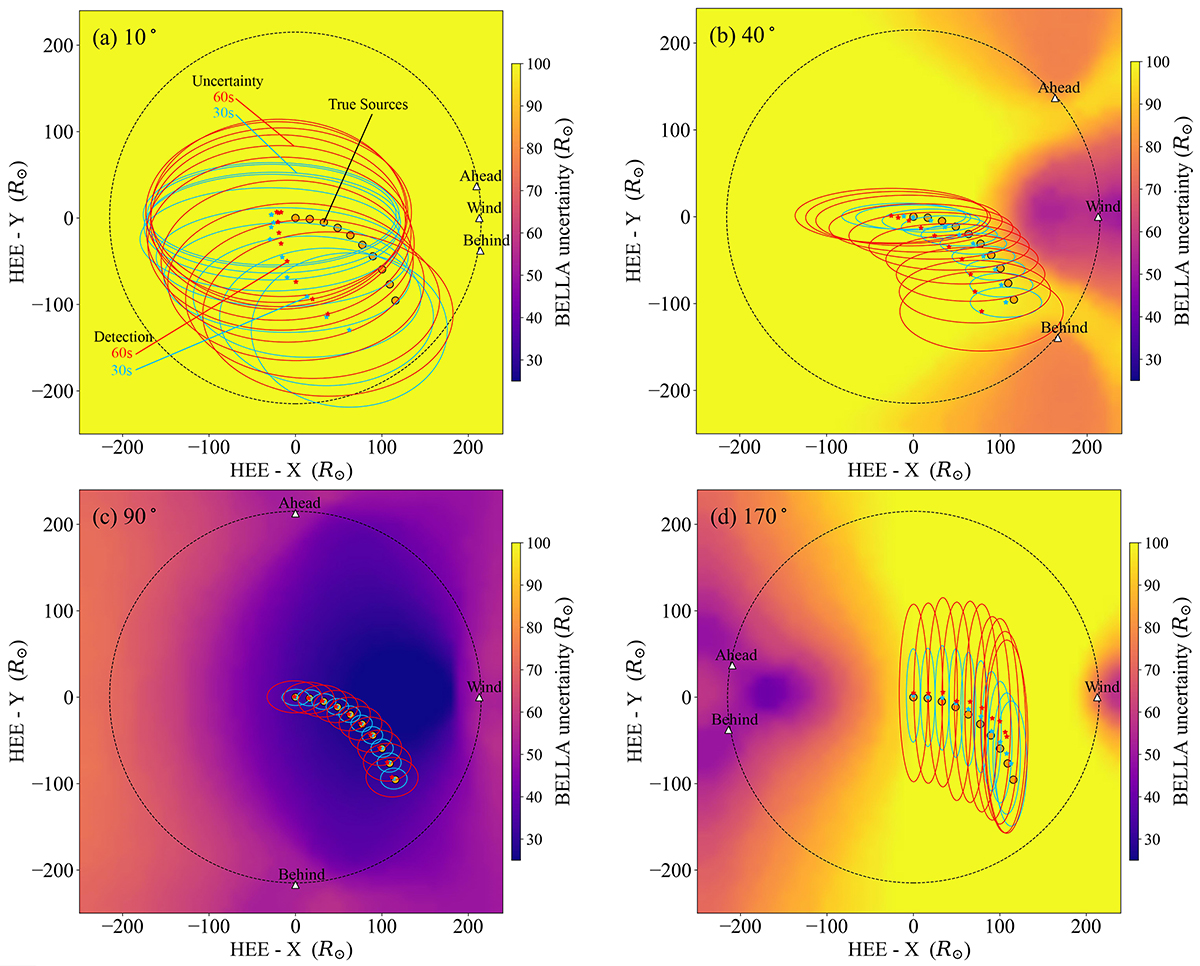
Fig. 3.
Download original image
Simulated radio sources and their corresponding BELLA detection at (a) ±10°, (b) ±40°, (c) ±90°, and (d) ±170° of Ahead-Behind separation with respect to Wind. Orange dots are the true location of the sources, and stars and ellipses are their corresponding detection and uncertainties, respectively. At each spacecraft configuration, simulations were performed twice with different cadences: 30 s (blue) and 60 s (red). The background maps were generated at a 60-s cadence and show a general overview of the multilateration uncertainty. Uncertainty of the measurements is dominated by the cadence of the instruments and the location of the spacecraft. The best performance of the multilateration technique occurs when the separation angles between all spacecraft are maximised and widely distributed.
Current usage metrics show cumulative count of Article Views (full-text article views including HTML views, PDF and ePub downloads, according to the available data) and Abstracts Views on Vision4Press platform.
Data correspond to usage on the plateform after 2015. The current usage metrics is available 48-96 hours after online publication and is updated daily on week days.
Initial download of the metrics may take a while.