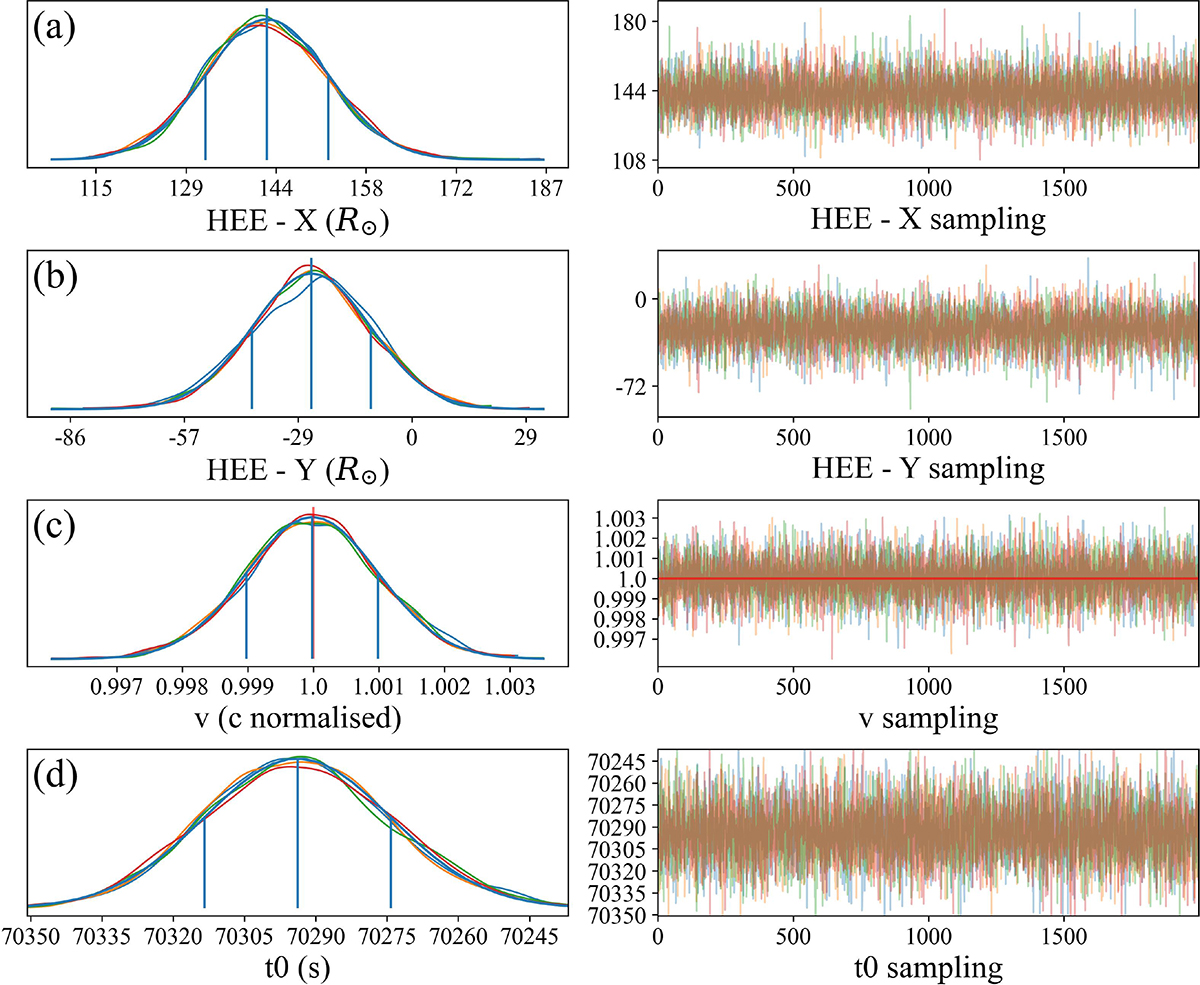
Fig. 2.
Download original image
Example trace plots of the posterior distributions from BELLA at 0.154 MHz. Sampling chains are shown in the right column, while the corresponding distributions are shown in the left column. Vertical lines on the distributions show the peak and 1σ range of a combined distribution. Panels a and b are X and Y coordinate distributions, respectively, where the peaks are the coordinates of the source of the emission and 1σ shows the area of confidence. Panel c is the speed of propagation of the emission, v. The speed of propagation was allowed to be greater than c for the purposes of testing if the distribution converged at v = c or v < c. A red line is displayed as a quick view of the v = c limit. Panel d shows the time of emission t0 of the burst in seconds from midnight. The peak of the t0 distribution shows the most likely time of the emission, and 1σ shows the region of uncertainty for this time of emission.
Current usage metrics show cumulative count of Article Views (full-text article views including HTML views, PDF and ePub downloads, according to the available data) and Abstracts Views on Vision4Press platform.
Data correspond to usage on the plateform after 2015. The current usage metrics is available 48-96 hours after online publication and is updated daily on week days.
Initial download of the metrics may take a while.