Open Access
Fig. 5.
Download original image
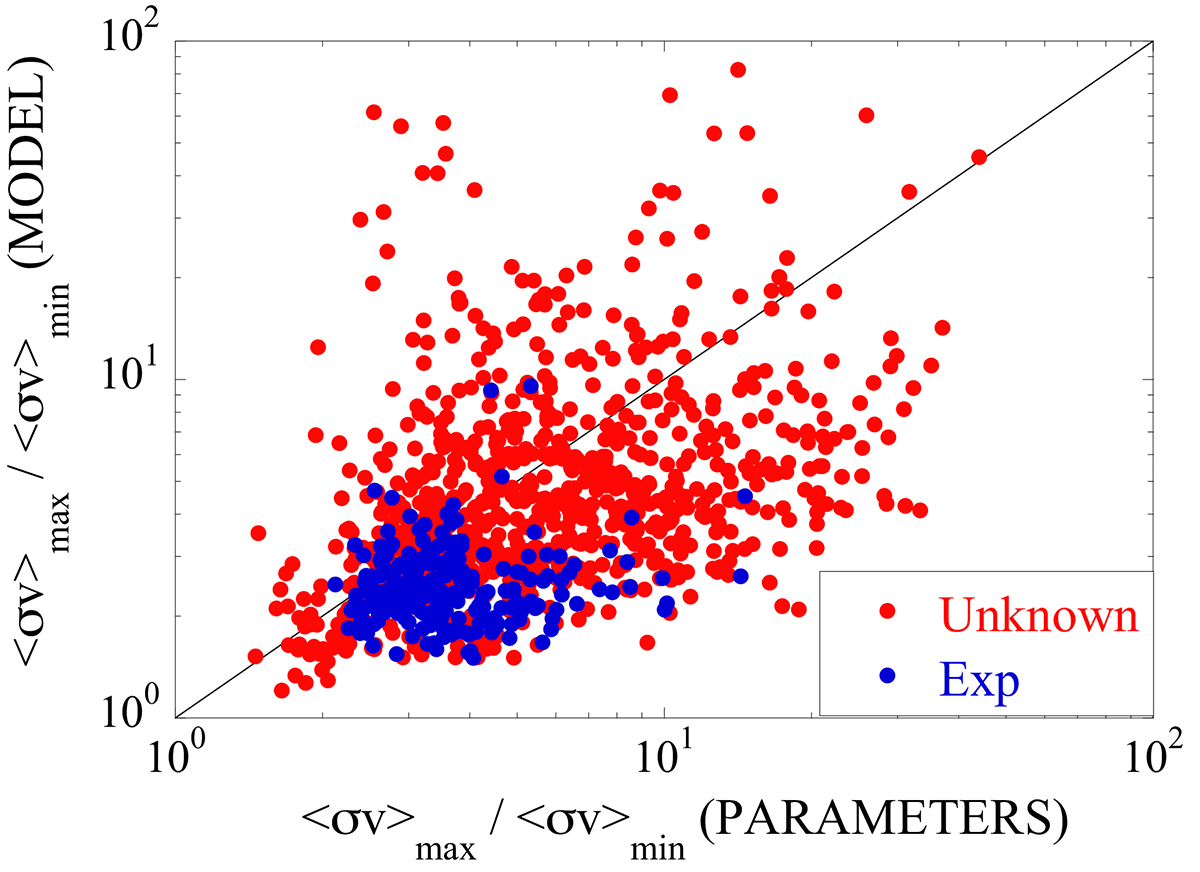
Correlated model uncertainties represented by the ratio of the maximum to minimum (n, γ) MACS (Fig. 4a) as a function of uncorrelated parameter uncertainties of set B (Fig. 4b). The 239 experimentally known (n, γ) reactions are shown in blue and the 868 theoretical ones in red. All rates are estimated at T = 2.5 × 10⁸ K.
Current usage metrics show cumulative count of Article Views (full-text article views including HTML views, PDF and ePub downloads, according to the available data) and Abstracts Views on Vision4Press platform.
Data correspond to usage on the plateform after 2015. The current usage metrics is available 48-96 hours after online publication and is updated daily on week days.
Initial download of the metrics may take a while.