Open Access
Fig. 10.
Download original image
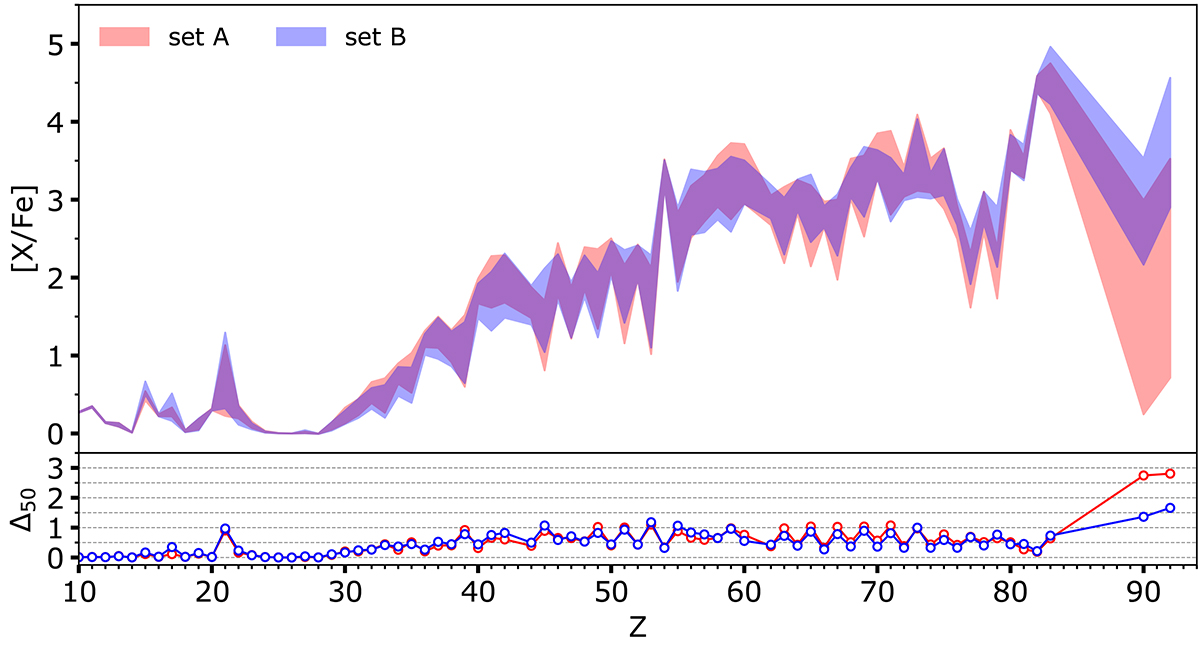
Comparison between the surface abundances [X/Fe] and their uncertainties obtained with nuclear sets A and B, for frms ≤ 2.0 case. The red (blue) region shows the extent of the [X/Fe] region between the 5th and 95th percentile for set A (set B). The purple area shows the intersection between the two models.
Current usage metrics show cumulative count of Article Views (full-text article views including HTML views, PDF and ePub downloads, according to the available data) and Abstracts Views on Vision4Press platform.
Data correspond to usage on the plateform after 2015. The current usage metrics is available 48-96 hours after online publication and is updated daily on week days.
Initial download of the metrics may take a while.