Fig. 7
Download original image
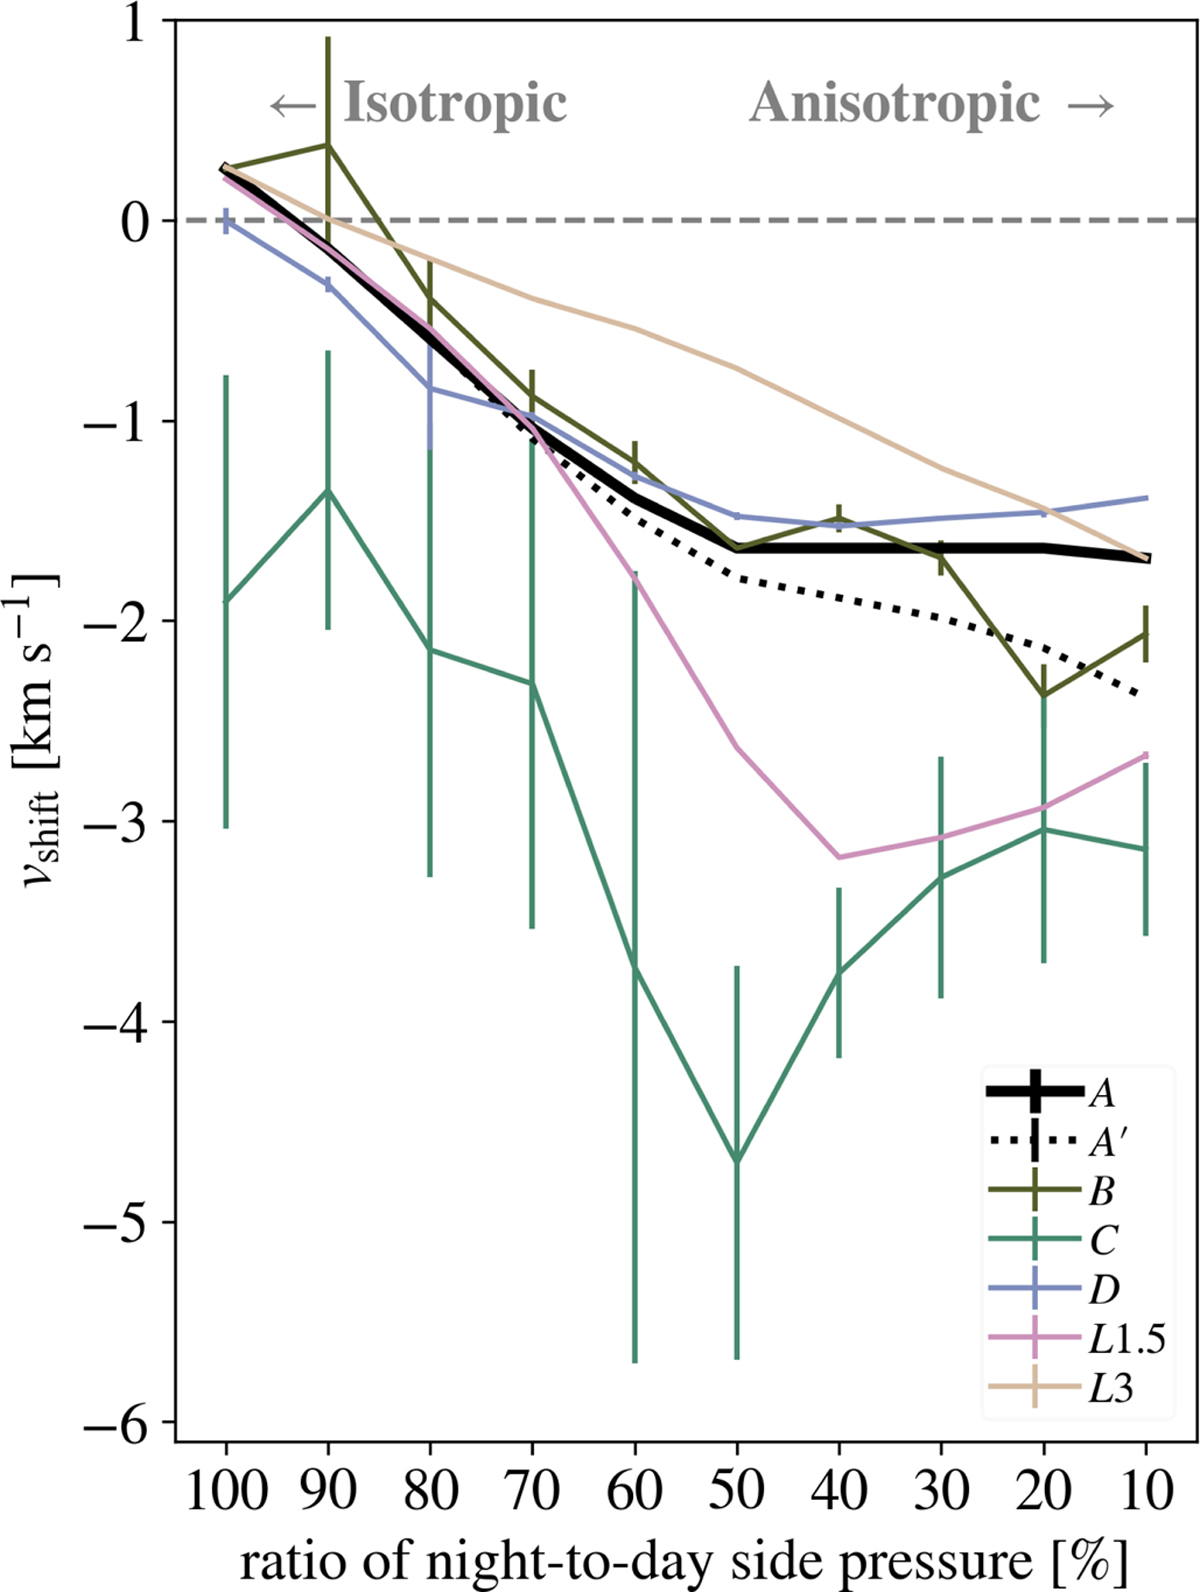
Mid-transit velocity shift of the dominant (red) component in the helium 1083 nm triplet as a function of the night-to-day side pressure ratio. The data points represent the average velocity shift over five snapshots in the steady-state, with error bars indicating the corresponding standard deviation. All models show the same trend: the line becomes more blueshifted with increasing day-night anisotropy. However, for ratios <50%, this behavior shifts, due to the occurrence of incident material on the night side. A represents the fiducial model group, including A′, with the distinction that the latter employs a constant ṁp instead of a constant ρp as outlined in Sect. 3.3 (see full model overview in Table 1).
Current usage metrics show cumulative count of Article Views (full-text article views including HTML views, PDF and ePub downloads, according to the available data) and Abstracts Views on Vision4Press platform.
Data correspond to usage on the plateform after 2015. The current usage metrics is available 48-96 hours after online publication and is updated daily on week days.
Initial download of the metrics may take a while.