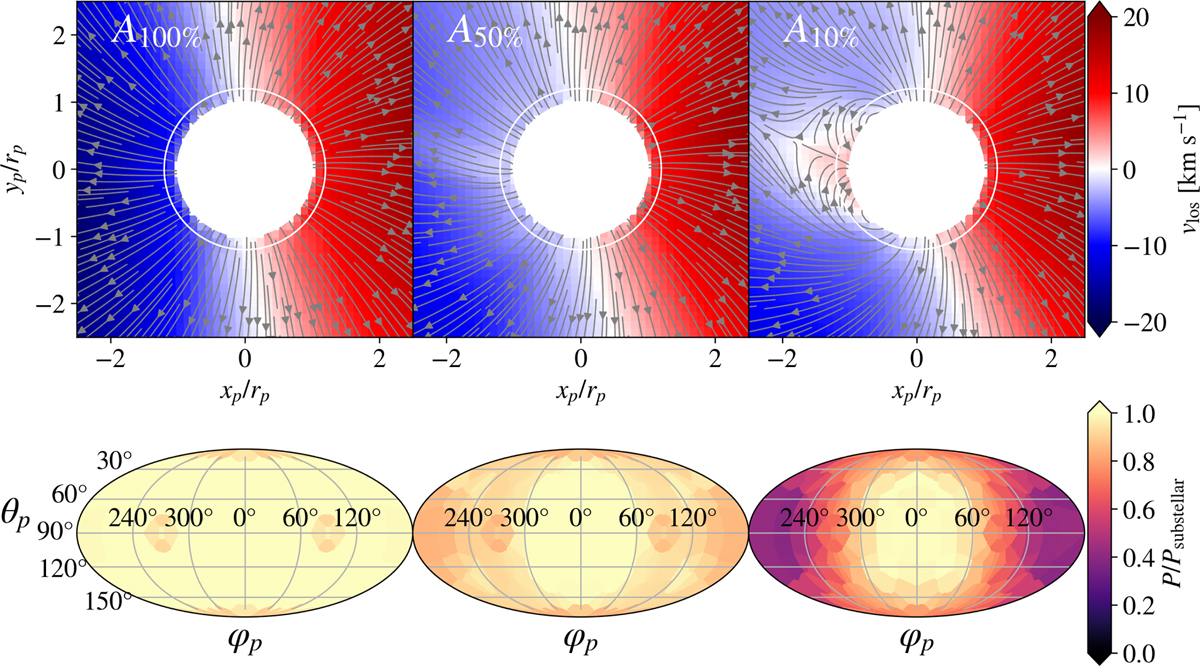
Fig. 4
Download original image
Line-of-sight velocity map in the close vicinity of the planet (top). The observer is located in the –x and the star in the + x-direction. Overplotted streamlines illustrate the flow patterns and show the fallback of material on the planet’s night side. The white outline indicates the radius (r = 1.2 Rp) of the sphere whose projected surface is shown in the maps below. Due to the incident material, the pressure on the night side in model A10% reaches only 40% instead of the expected 10% of the pressure on the day side in the evolved simulation.
Current usage metrics show cumulative count of Article Views (full-text article views including HTML views, PDF and ePub downloads, according to the available data) and Abstracts Views on Vision4Press platform.
Data correspond to usage on the plateform after 2015. The current usage metrics is available 48-96 hours after online publication and is updated daily on week days.
Initial download of the metrics may take a while.