Fig. 3
Download original image
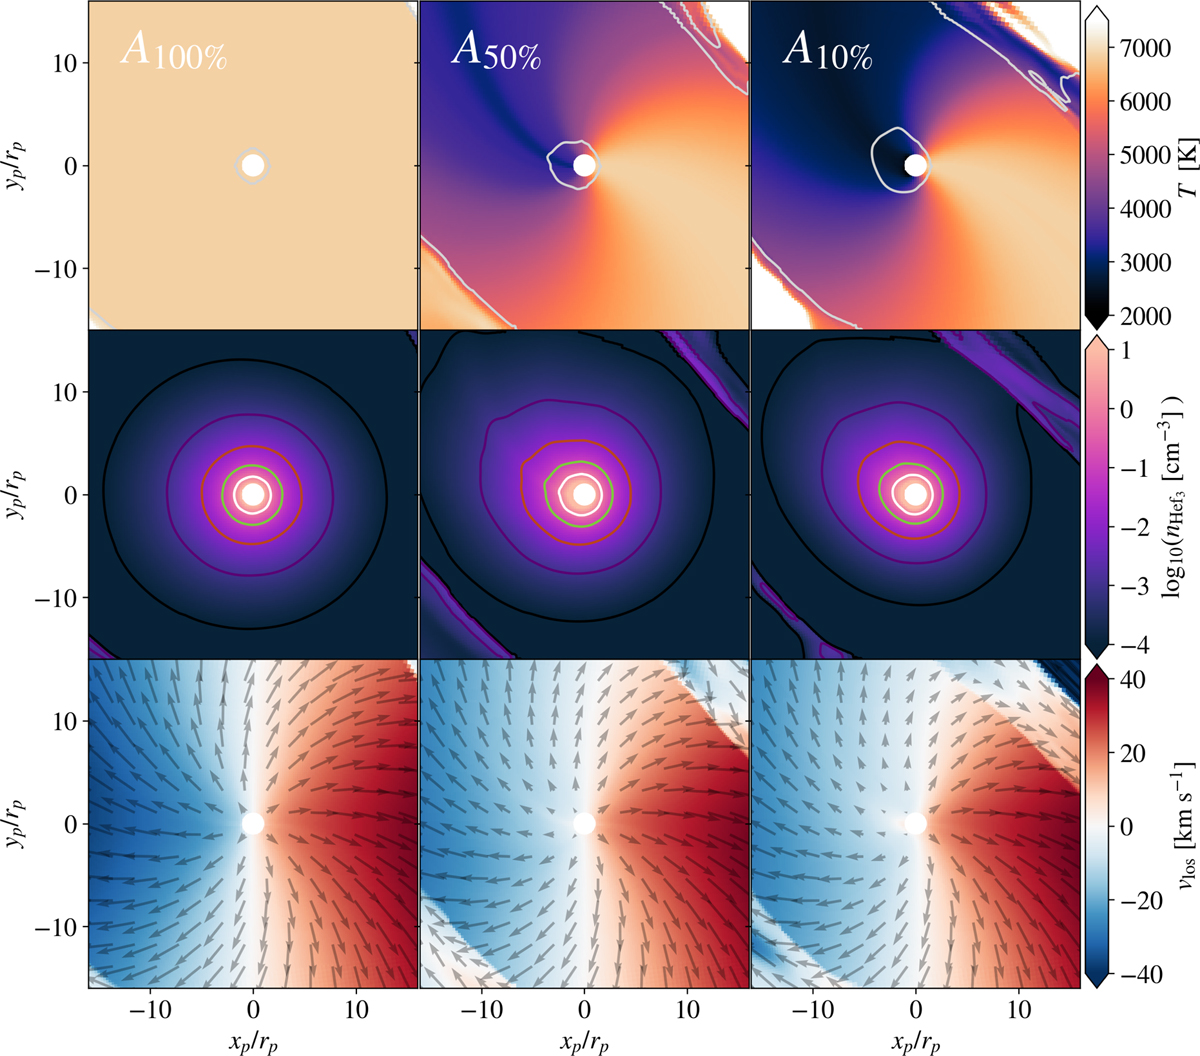
Temperature (top), number density of metastable helium (middle), and line-of-sight velocity (bottom) in the vicinity of the planet for increasing day-night side anisotropy from left to right. The contours in the top row are indicating the sonic surface, while the middle row displays contours of the number density of metastable helium. These contours range from light to dark and correspond to values of ![]() , 10−1, 10−2, 10−3, and 10−4, respectively. Velocity quivers are added in the bottom panels. The observer is located in the –x direction and the star in the + x-direction. The plot displays the equatorial slice from a top-down perspective. By introducing anisotropy, the gas density increases toward the second quadrant (i.e., upper left) and the line-of-sight velocity becomes asymmetric around xp = 0.
, 10−1, 10−2, 10−3, and 10−4, respectively. Velocity quivers are added in the bottom panels. The observer is located in the –x direction and the star in the + x-direction. The plot displays the equatorial slice from a top-down perspective. By introducing anisotropy, the gas density increases toward the second quadrant (i.e., upper left) and the line-of-sight velocity becomes asymmetric around xp = 0.
Current usage metrics show cumulative count of Article Views (full-text article views including HTML views, PDF and ePub downloads, according to the available data) and Abstracts Views on Vision4Press platform.
Data correspond to usage on the plateform after 2015. The current usage metrics is available 48-96 hours after online publication and is updated daily on week days.
Initial download of the metrics may take a while.