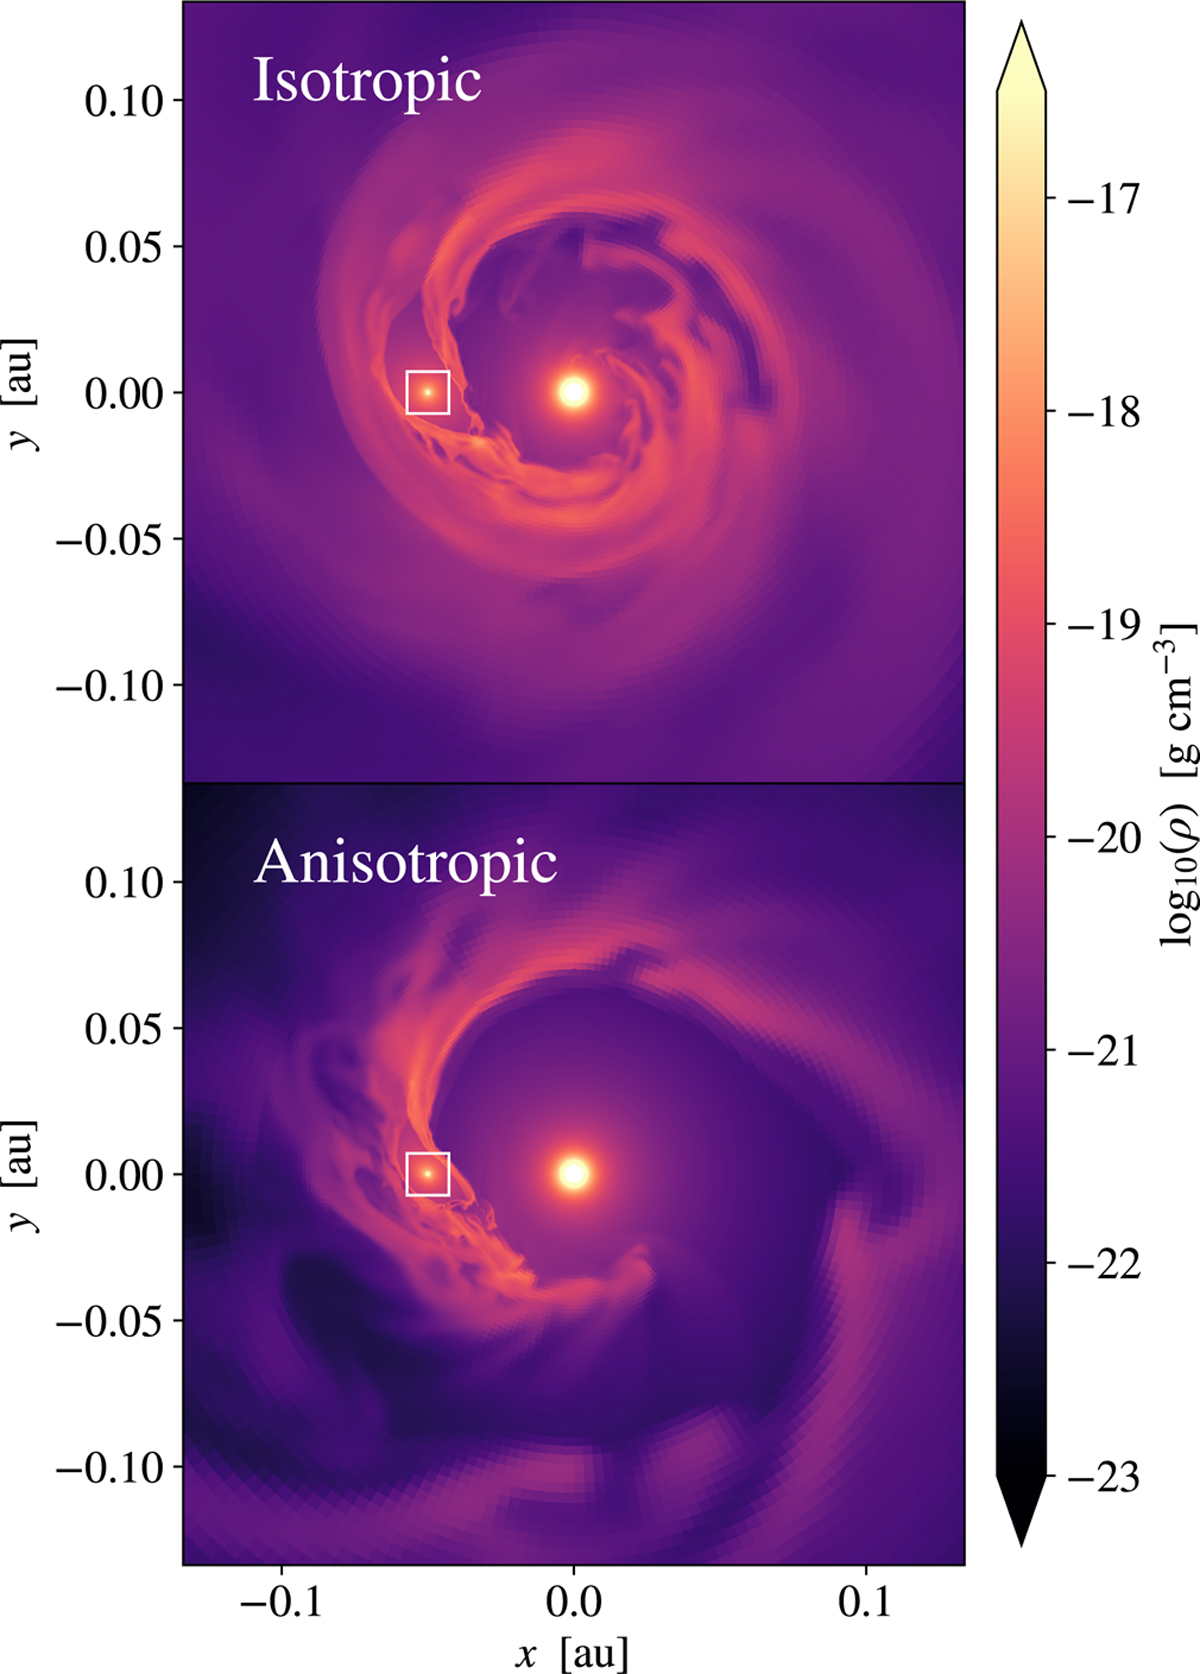
Fig. 2
Download original image
Gas density in the orbital midplane, showing the hydrodynamic winds generated by a model exoplanet interacting with the stellar wind emanating from the central star. We assume that the observer is located in the direction -x. The white square marks the region around the planet shown in the following figures. The top figure illustrates a planetary wind with isotropic boundary conditions (A100%), while the bottom figure incorporates day-night anisotropy (A10%). In the anisotropic scenario, the decreased pressure on the night side leads to a reduction in the mass-loss rate of the planet. As a result, the outflow becomes less extended compared to the isotropic case.
Current usage metrics show cumulative count of Article Views (full-text article views including HTML views, PDF and ePub downloads, according to the available data) and Abstracts Views on Vision4Press platform.
Data correspond to usage on the plateform after 2015. The current usage metrics is available 48-96 hours after online publication and is updated daily on week days.
Initial download of the metrics may take a while.