Fig. D.3
Download original image
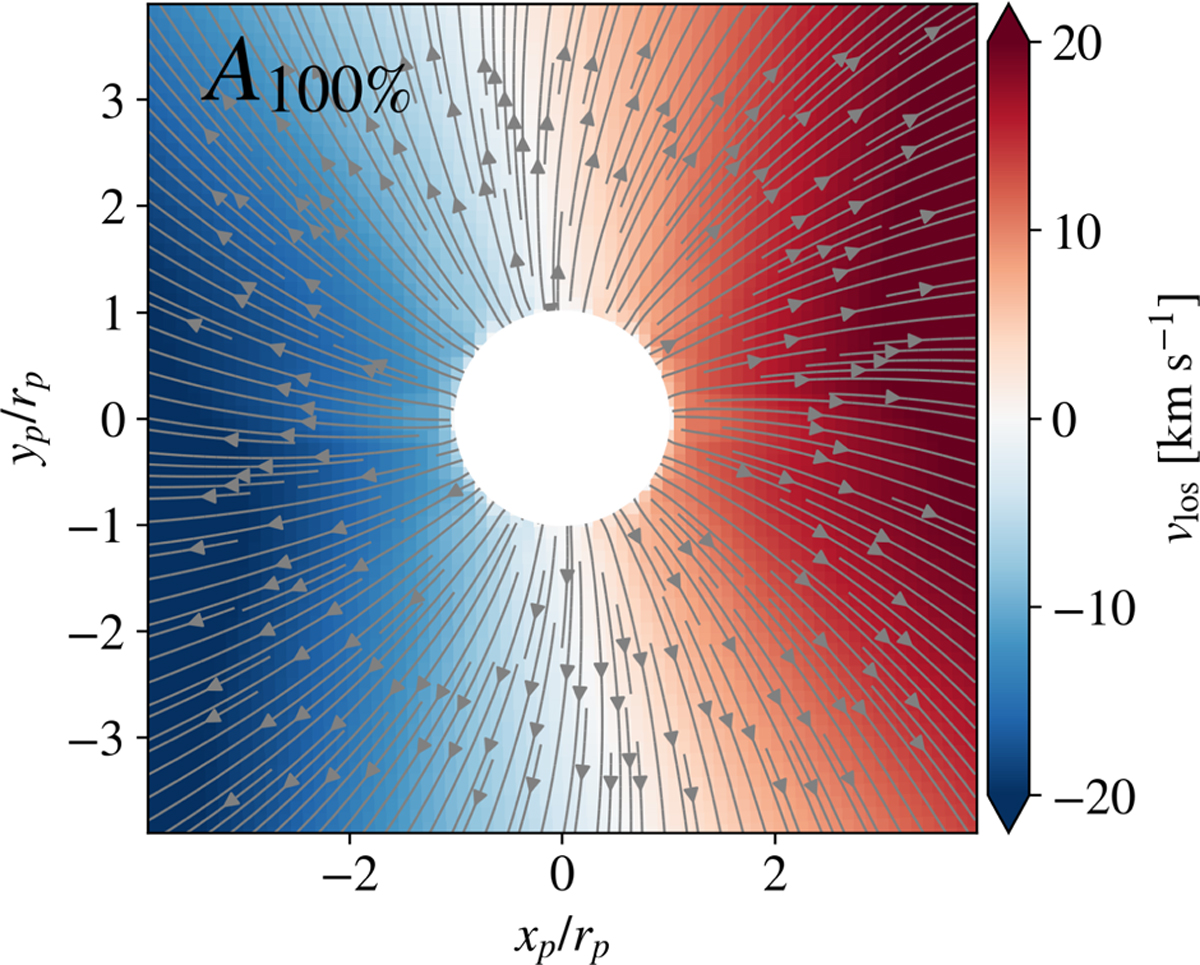
(Movie online) A sequence of evolved snapshots displaying the line-of-sight velocity around the planet, accompanied by over-plotted streamlines depicting the infalling material on the night side at high degrees of day-night anisotropy; with model A100% representing the isotropic case and model A10% exemplifying the most anisotropic scenario. Notably, the occurrence of fallback can be directly linked to the saturation of the blueshift shown in Figure 7.
Current usage metrics show cumulative count of Article Views (full-text article views including HTML views, PDF and ePub downloads, according to the available data) and Abstracts Views on Vision4Press platform.
Data correspond to usage on the plateform after 2015. The current usage metrics is available 48-96 hours after online publication and is updated daily on week days.
Initial download of the metrics may take a while.