Fig. 1
Download original image
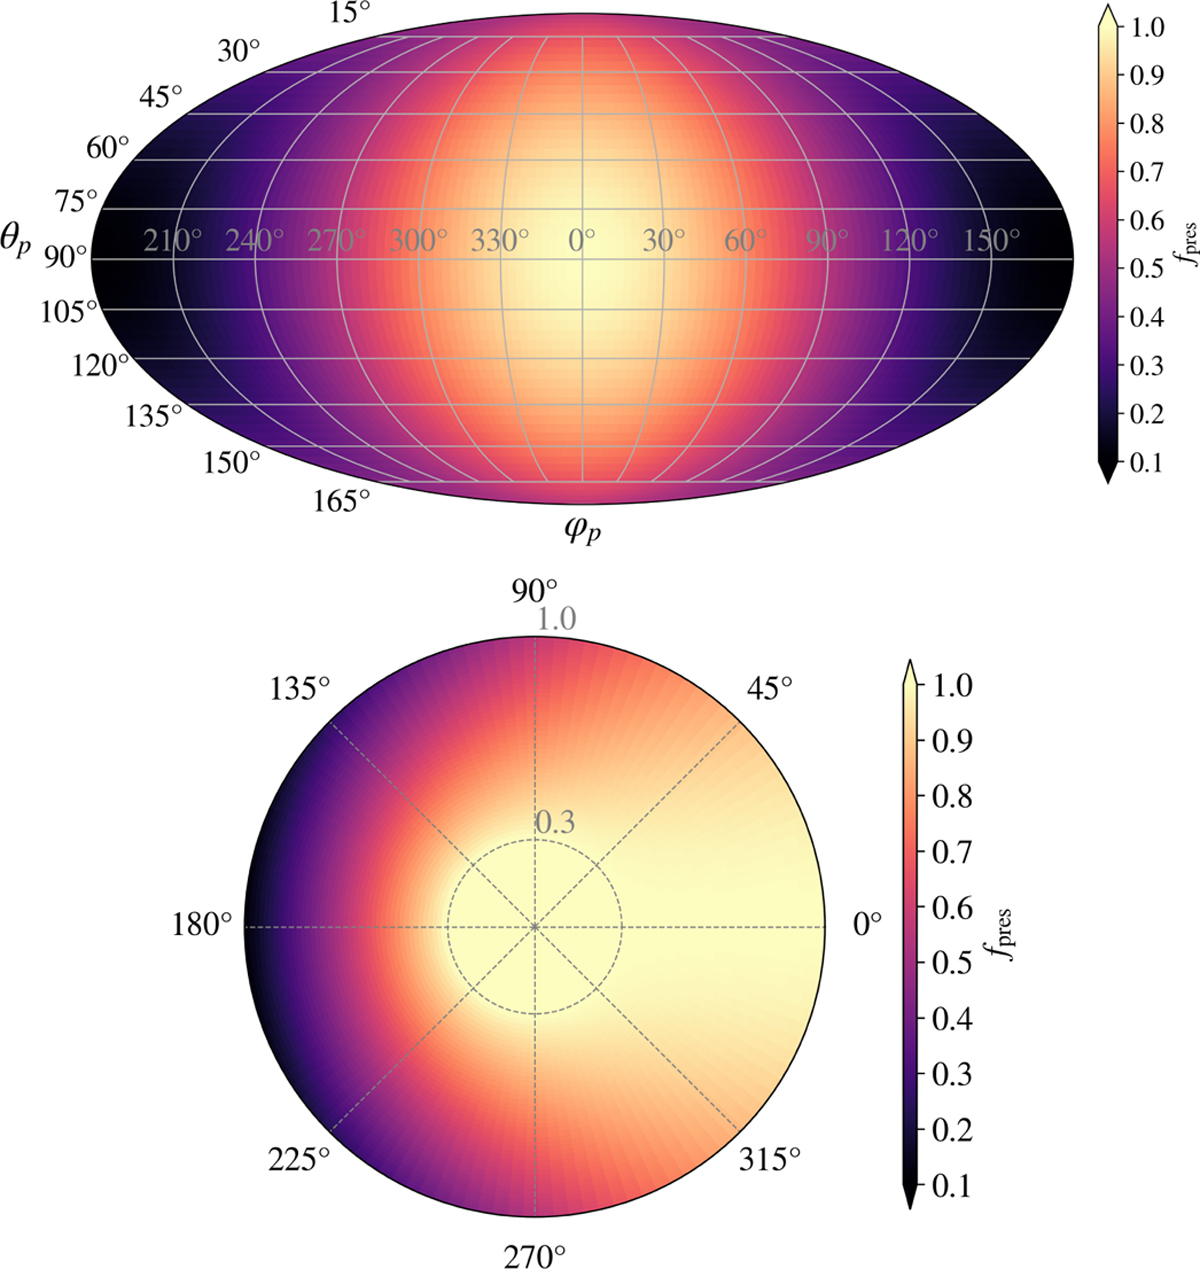
Maps of the pressure scaling factor of the planetary boundary condition. The upper panel shows the pressure scaling factor, fpres along the planet surface, in the case where the value at the antistellar point (φp = 180°, θp = 90°) is 10% of the value at the substellar point (φp = 0,θp = 90°). The lower panel shows a slice through the planet, in which the observer is located in the –x and the star in the + x-direction. For models with a lower degree of anisotropy, a similar distribution is used, only with a different minimum value on the night side ![]() .
.
Current usage metrics show cumulative count of Article Views (full-text article views including HTML views, PDF and ePub downloads, according to the available data) and Abstracts Views on Vision4Press platform.
Data correspond to usage on the plateform after 2015. The current usage metrics is available 48-96 hours after online publication and is updated daily on week days.
Initial download of the metrics may take a while.