Fig. 3
Download original image
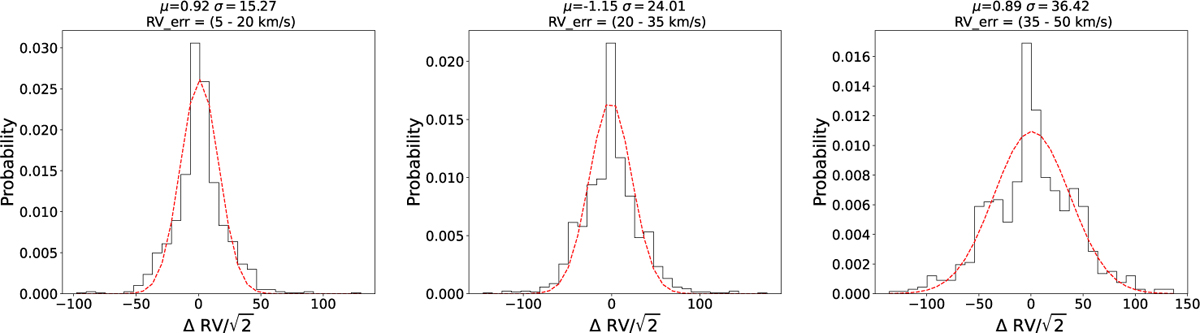
Distributions of RV differences between two epochs of the same WDs, scaled down by ![]() , along with Gaussian fits to the distributions (dashed red lines), for pairs of measurements having pair-averaged calculated RV fitting errors of 5–20 km s−1 (left), 20–35 km s−1 (centre), and 35– 50 km s−1 (right). The distributions appear Gaussian with a σ close to the expected value. This alignment indicates the reliability of the calculated RV errors.
, along with Gaussian fits to the distributions (dashed red lines), for pairs of measurements having pair-averaged calculated RV fitting errors of 5–20 km s−1 (left), 20–35 km s−1 (centre), and 35– 50 km s−1 (right). The distributions appear Gaussian with a σ close to the expected value. This alignment indicates the reliability of the calculated RV errors.
Current usage metrics show cumulative count of Article Views (full-text article views including HTML views, PDF and ePub downloads, according to the available data) and Abstracts Views on Vision4Press platform.
Data correspond to usage on the plateform after 2015. The current usage metrics is available 48-96 hours after online publication and is updated daily on week days.
Initial download of the metrics may take a while.