Fig. 9
Download original image
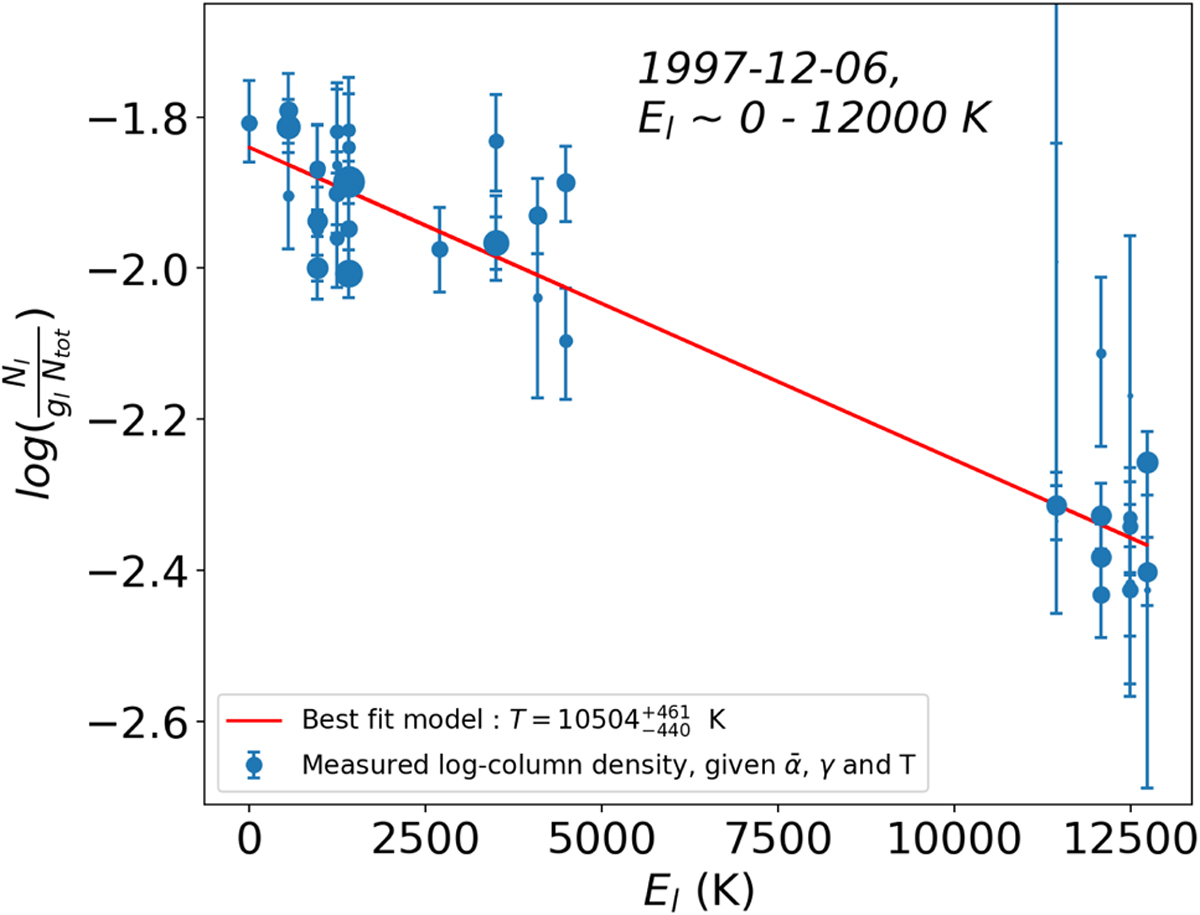
Excitation diagram of Fe II within the December 6, 1997 comet, obtained using absorption measurements in the [+25; +40] km s−1 radial velocity range. The y-axis represents the log-relative abundance of the studied Fe II energy levels, within an additive constant (see Eq. (5)), while the x-axis indicates the energy of these levels. Each point thus represents an abundance estimate of an energy level l, based on the measurement of the absorption depth in a given line (l, u). As some lines rise from the same energy level, some of these levels benefit from several independent abundance measurements. The marker sizes are inversely proportional to the vertical uncertainties.
Current usage metrics show cumulative count of Article Views (full-text article views including HTML views, PDF and ePub downloads, according to the available data) and Abstracts Views on Vision4Press platform.
Data correspond to usage on the plateform after 2015. The current usage metrics is available 48-96 hours after online publication and is updated daily on week days.
Initial download of the metrics may take a while.