Fig. 5
Download original image
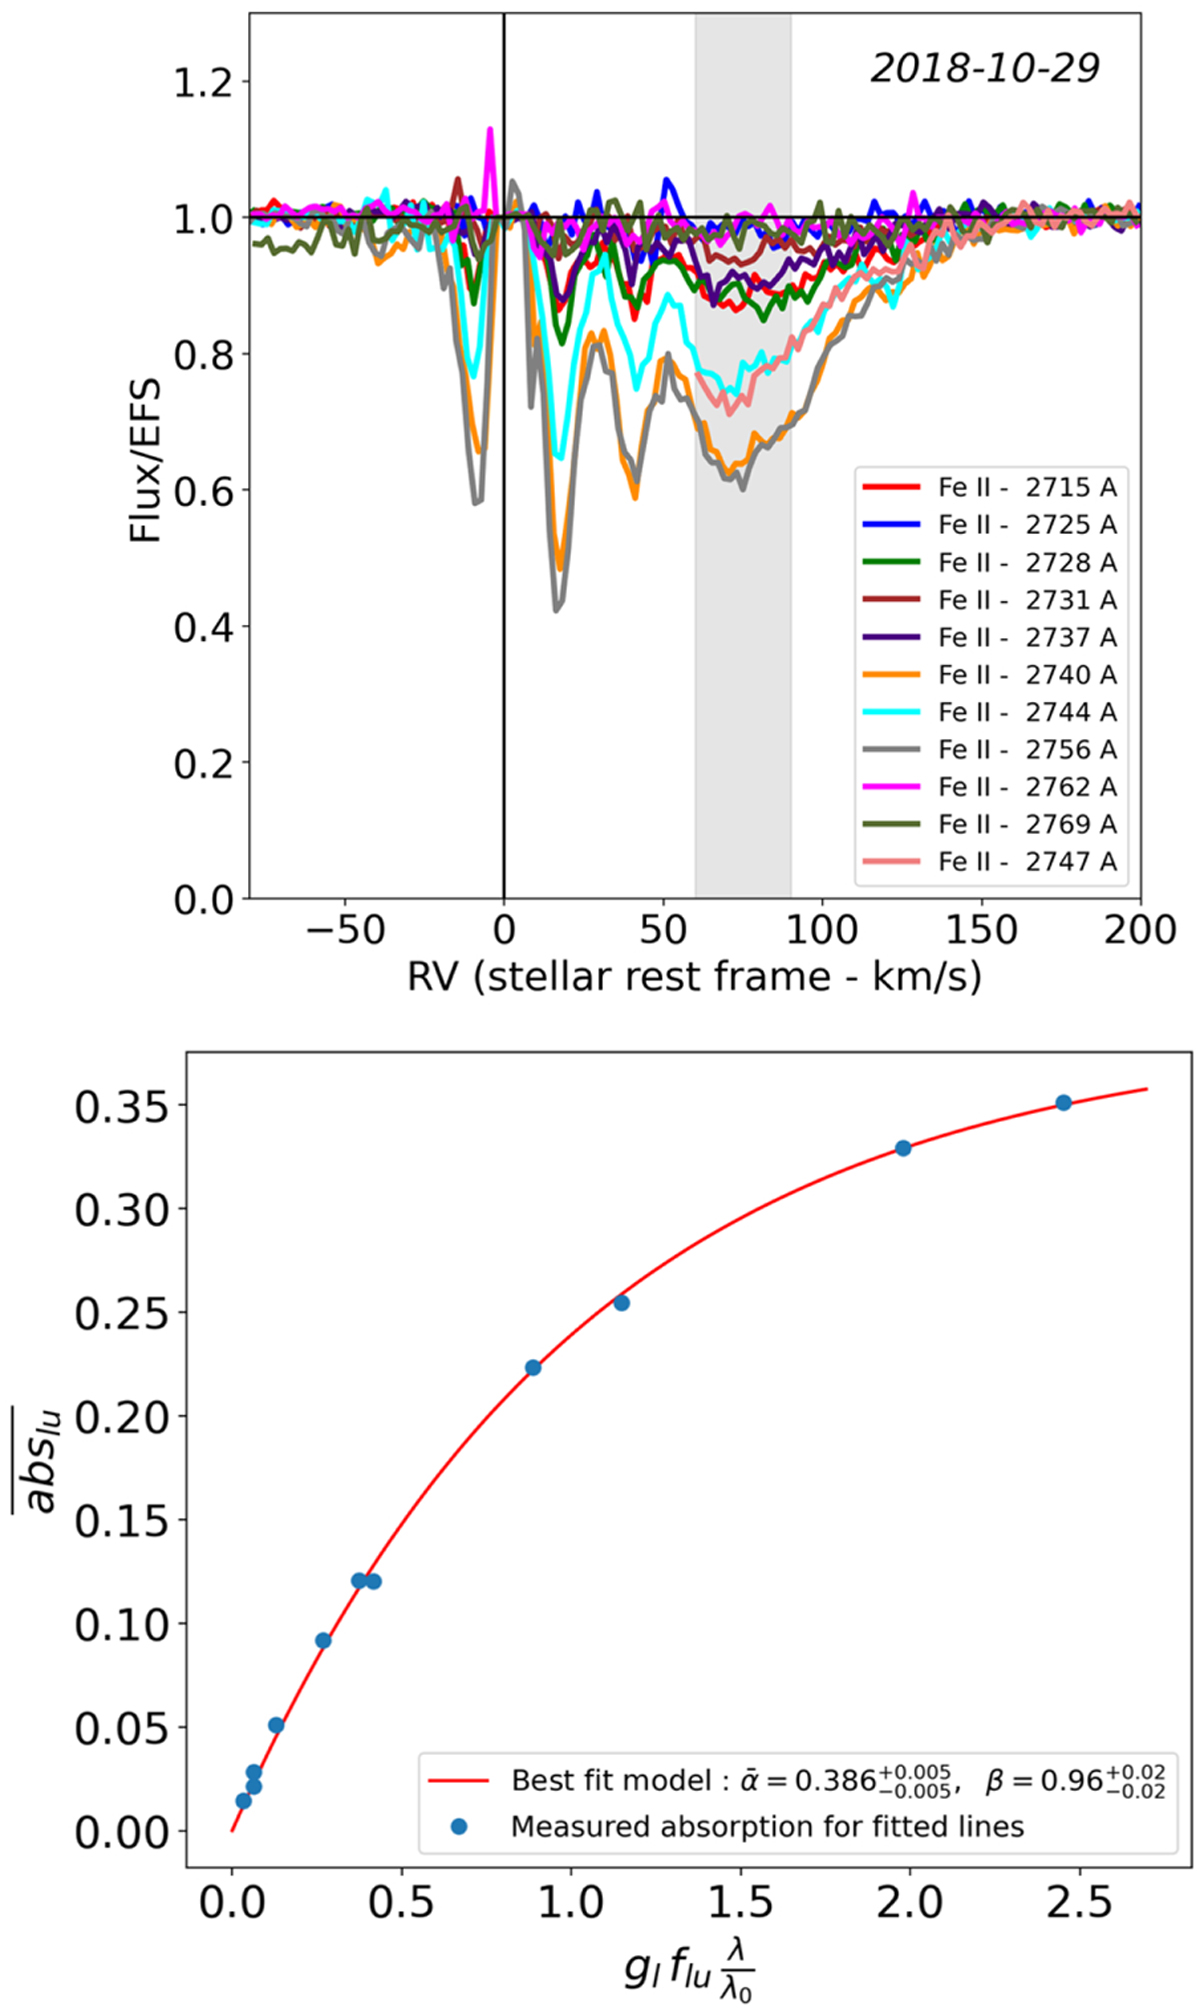
Analysis of the October 29, 2018 comet. Top: cometary absorption spectrum of October 29, 2018 observation in a4D Fe II lines around 2750 Å. The grey zone represents the radial velocity range [+60; +90] km s−1, which was used to measure the cometary absorptions. Bottom: curve of growth of the same Fe II lines, showing the mean absorption depths measured in the [+60; +90] km s−1 range (blue dots) and the two-parameter fitted model (red line) as a function of the line absorbing strength. The uncertainties on the absorption measurements are of the order of the marker’s size, thanks to the very good S/N (~100) of the October 29, 2018 observation.
Current usage metrics show cumulative count of Article Views (full-text article views including HTML views, PDF and ePub downloads, according to the available data) and Abstracts Views on Vision4Press platform.
Data correspond to usage on the plateform after 2015. The current usage metrics is available 48-96 hours after online publication and is updated daily on week days.
Initial download of the metrics may take a while.