Fig. 10
Download original image
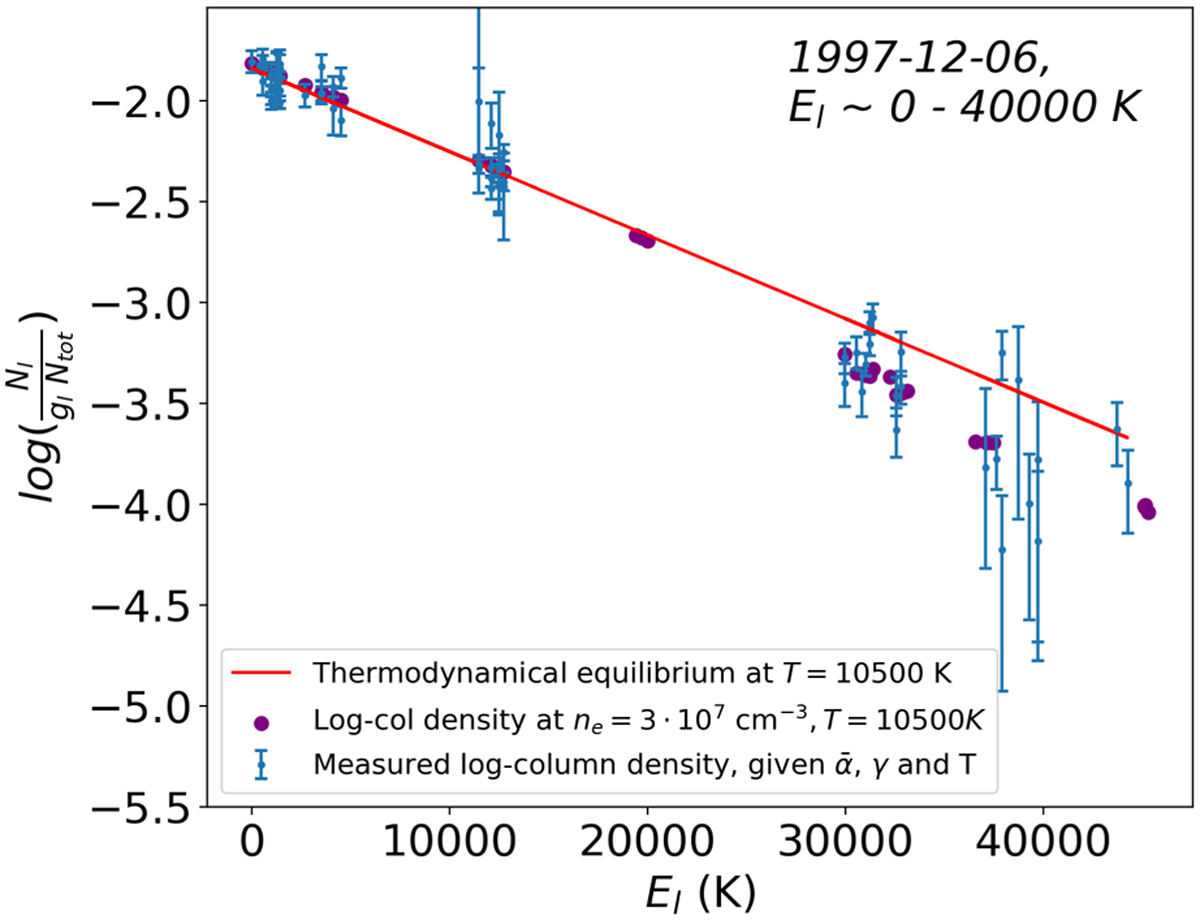
Full excitation diagram of Fe II within December 6, 1997 comet showing measured column-density of various energy levels inferred from the measured absorptions and the parameters obtained in Sect. 5.1 (blue dots), the theoretical energy distribution at LTE (red line), and the theoretical energy distribution with an electron density of 3 × 107 cm−3 for a few representative energy levels as computed using ChiantiPy (purple dots).
Current usage metrics show cumulative count of Article Views (full-text article views including HTML views, PDF and ePub downloads, according to the available data) and Abstracts Views on Vision4Press platform.
Data correspond to usage on the plateform after 2015. The current usage metrics is available 48-96 hours after online publication and is updated daily on week days.
Initial download of the metrics may take a while.