Fig. 14.
Download original image
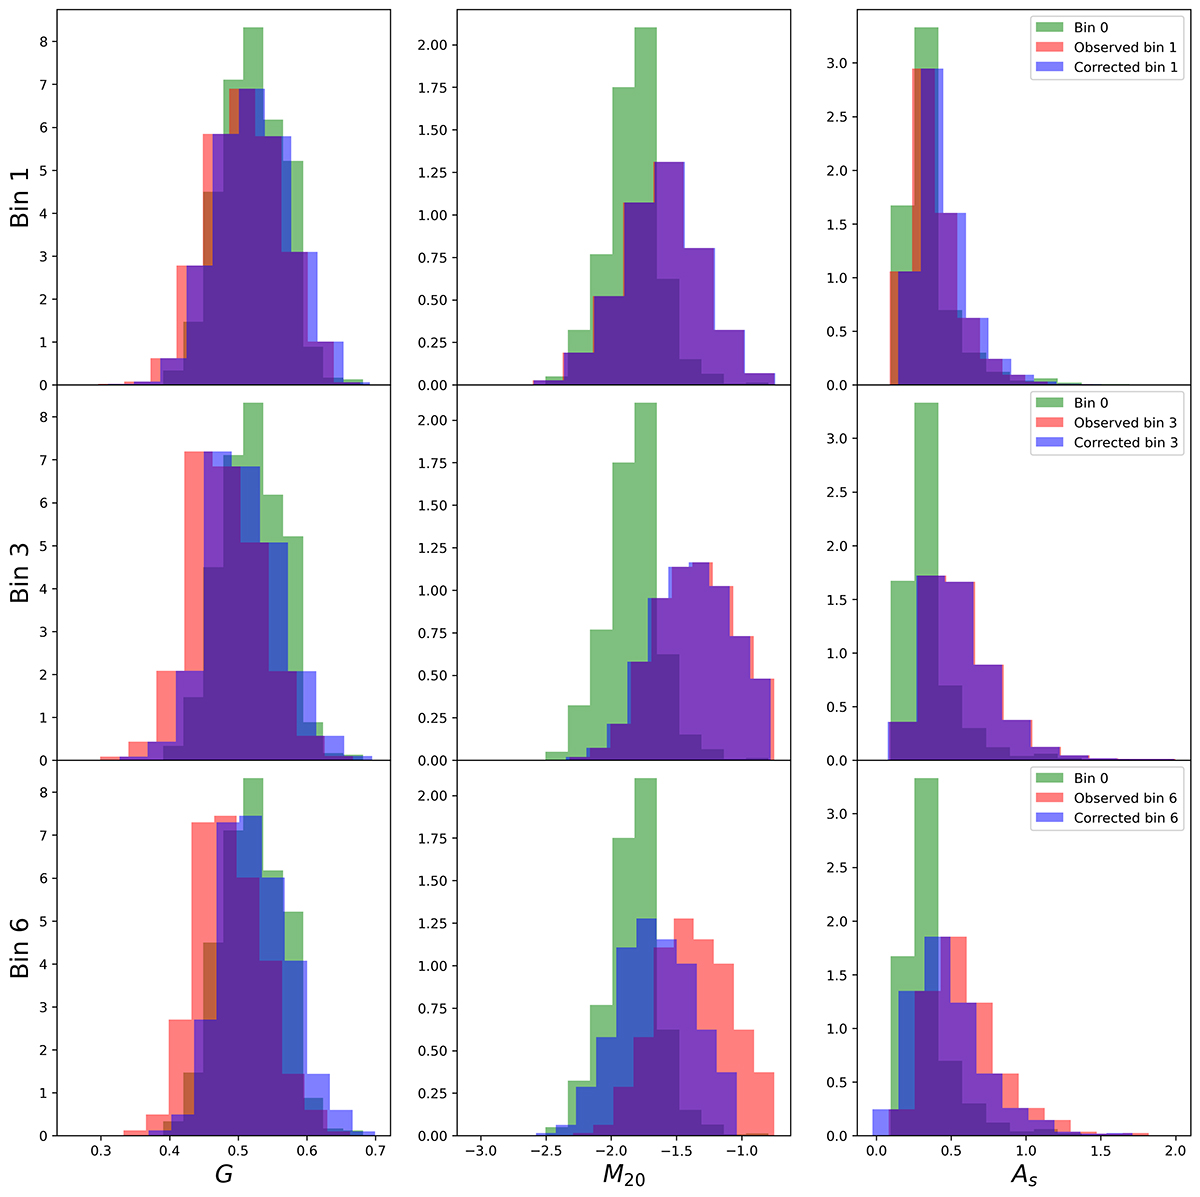
Distributions of G (left column), M20 (middle column), and As (right column) are plotted for bin 1 (top row), bin 3 (middle row), and bin 6 (bottom row), respectively. The red histograms represent the observed values and the blue represent the CSBD-corrected values. The distribution of coefficients measured in bin 0 is plotted as a green histogram. It can be seen that in bin 1 the corrected and uncorrected distributions appear similar, suggesting that the impact of CSBD is negligible. However, in bin 6, a more pronounced difference between the observed and corrected values is evident.
Current usage metrics show cumulative count of Article Views (full-text article views including HTML views, PDF and ePub downloads, according to the available data) and Abstracts Views on Vision4Press platform.
Data correspond to usage on the plateform after 2015. The current usage metrics is available 48-96 hours after online publication and is updated daily on week days.
Initial download of the metrics may take a while.