Fig. 29
Download original image
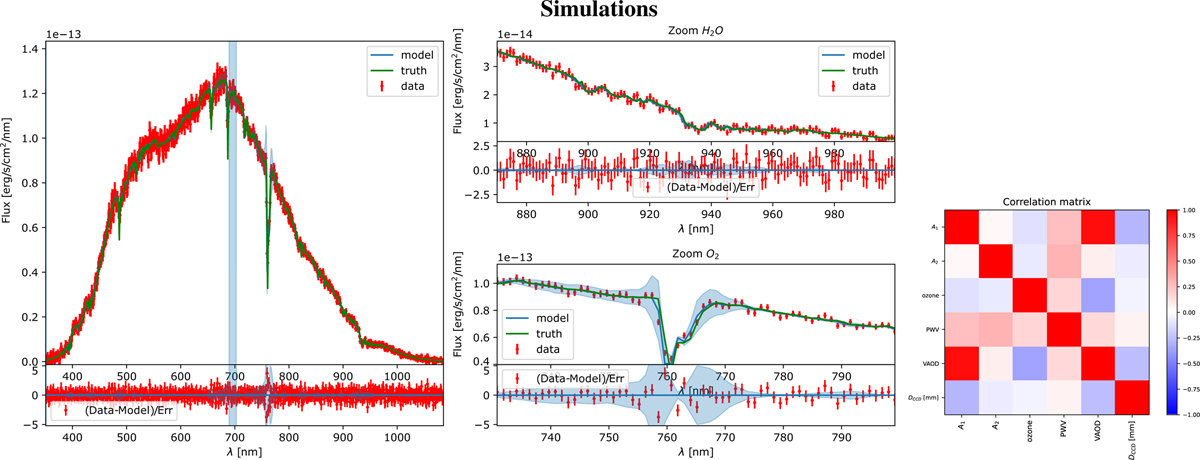
Results from the S1(λ) model fit on the spectrum of CALSPEC star HD111980, extracted from a simulated spectrogram. Left: spectrum data (red) compared with the best-fitting model (blue) and the model uncertainties (light blue band) due to the CTIO telescope transmission uncertainties, the true injected spectrum in the simulation (green), and the residuals (bottom). Middle: zoom around the dioxygen line at 762 nm and zoom on the H2O absorption band around 950 nm. Right: correlation matrix of the fitted parameters.
Current usage metrics show cumulative count of Article Views (full-text article views including HTML views, PDF and ePub downloads, according to the available data) and Abstracts Views on Vision4Press platform.
Data correspond to usage on the plateform after 2015. The current usage metrics is available 48-96 hours after online publication and is updated daily on week days.
Initial download of the metrics may take a while.