Fig. 13
Download original image
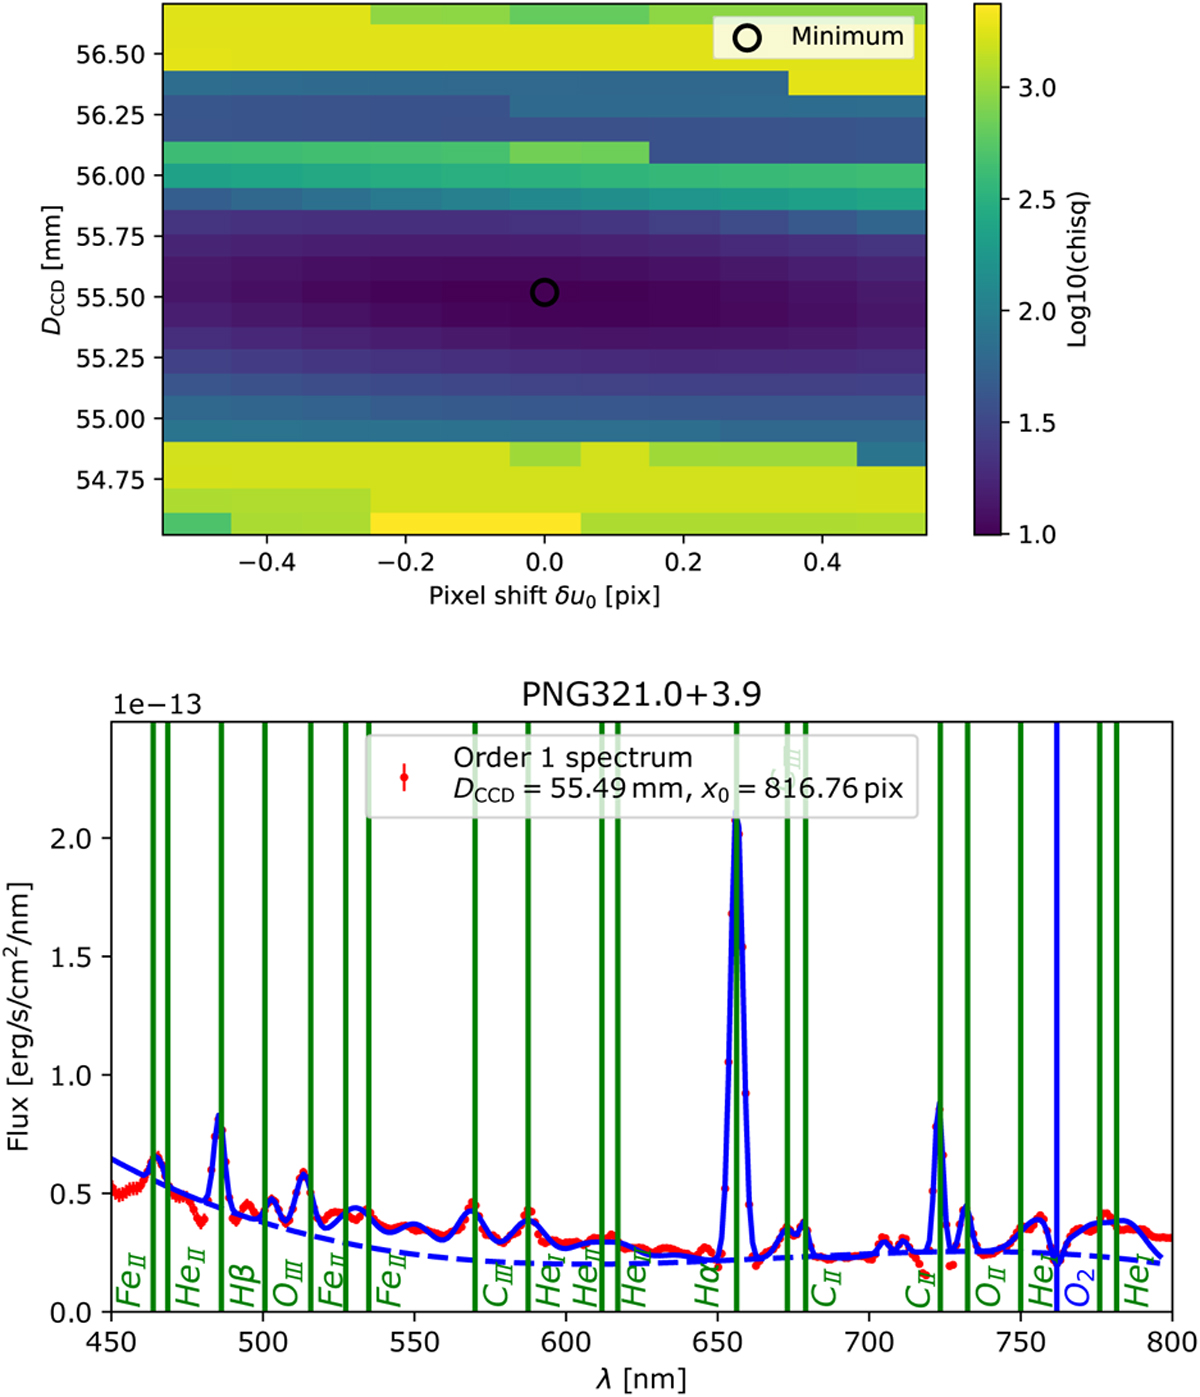
Wavelength-calibration process on a planetary nebula spectrum. Top: global ![]() function and its minimum (black circle) for the planetary nebula PNG321.0+3.9 observed at CTIO. The sharp steps at the top of the plot arise when certain lines are detected. Bottom: calibrated spectrum of PNG321.0+3.9. The vertical lines indicate emission or absorption lines that are detected, positioned at their tabulated values. The dashed blue lines show the fitted background (whose degree depends on its length), and the plain blue lines show the Gaussian profiles fitted on data.
function and its minimum (black circle) for the planetary nebula PNG321.0+3.9 observed at CTIO. The sharp steps at the top of the plot arise when certain lines are detected. Bottom: calibrated spectrum of PNG321.0+3.9. The vertical lines indicate emission or absorption lines that are detected, positioned at their tabulated values. The dashed blue lines show the fitted background (whose degree depends on its length), and the plain blue lines show the Gaussian profiles fitted on data.
Current usage metrics show cumulative count of Article Views (full-text article views including HTML views, PDF and ePub downloads, according to the available data) and Abstracts Views on Vision4Press platform.
Data correspond to usage on the plateform after 2015. The current usage metrics is available 48-96 hours after online publication and is updated daily on week days.
Initial download of the metrics may take a while.