Fig. 11
Download original image
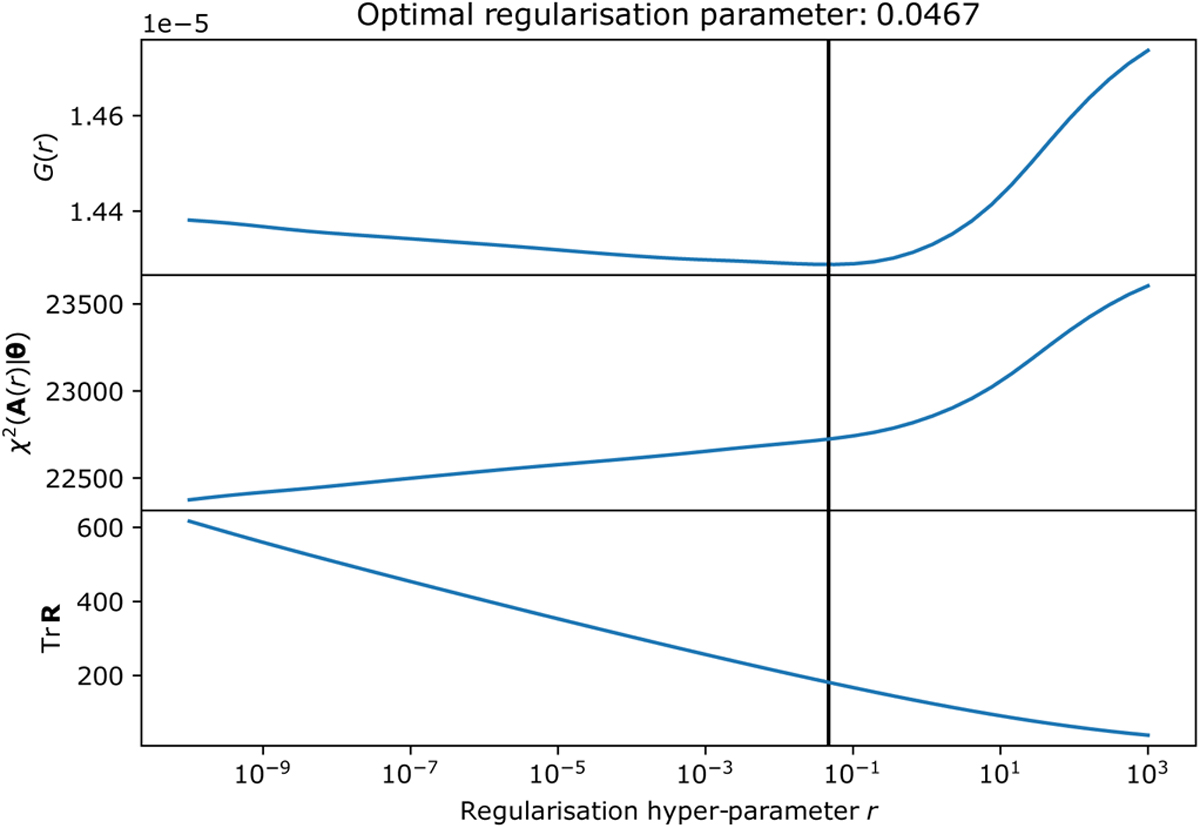
Optimisation of the r hyper-parameter for a simple simulation with nPSF = 0, γ0 = 5, α0 = 3 (and the same characteristics as in Table 1). Top: G(r) function (blue) and the minimum position r = 0.0467 (vertical black line). Middle: χ2 evolution with r. Bottom: trace of the resolution matrix Tr R. The intersection with the black line gives the effective number of parameters fitted by data, here, 180.
Current usage metrics show cumulative count of Article Views (full-text article views including HTML views, PDF and ePub downloads, according to the available data) and Abstracts Views on Vision4Press platform.
Data correspond to usage on the plateform after 2015. The current usage metrics is available 48-96 hours after online publication and is updated daily on week days.
Initial download of the metrics may take a while.