Fig. 10
Download original image
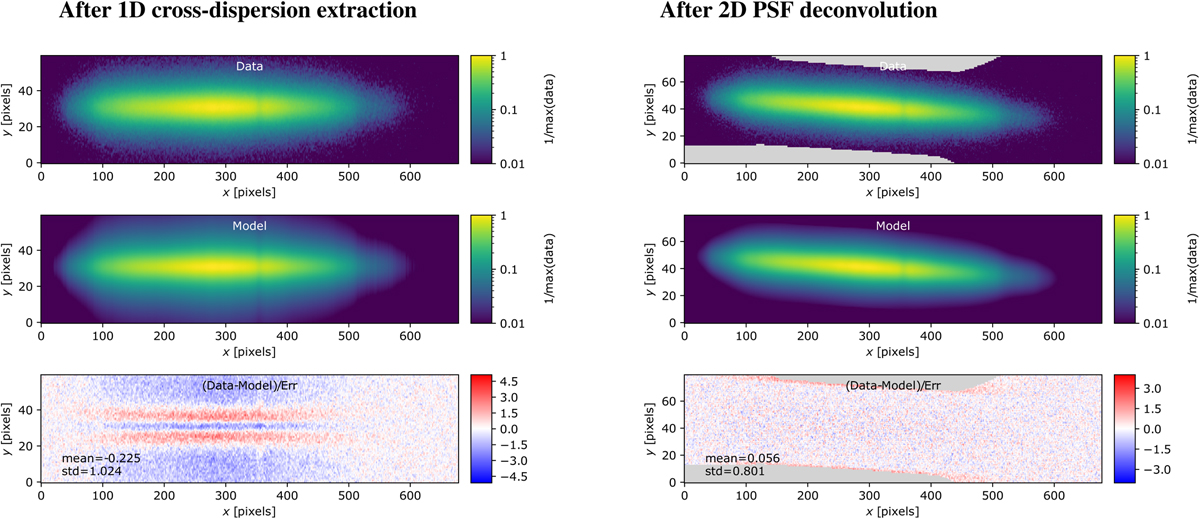
Results from the deconvolution of a simulated spectrogram of the CALSPEC star HD111980 with a Moffat PSF kernel, without second-order diffraction contamination, (γ0,γ1,γ2) = (10,2,5) and (α0, α1, α2) = (2, 0, 0). Left: simulated spectrogram (top), best-,fitting spectrogram model (middle) and residuals in units of σ (bottom) after the rotation process and the 1D transverse fit. Right: same simulated spectrogram with its original rotation (top), best-fitting spectrogram model (middle), and residuals in units of σ (bottom) after the deconvolution process. All colour maps are normalised by the maximum of the simulated spectrogram. The grey areas designate masked pixels.
Current usage metrics show cumulative count of Article Views (full-text article views including HTML views, PDF and ePub downloads, according to the available data) and Abstracts Views on Vision4Press platform.
Data correspond to usage on the plateform after 2015. The current usage metrics is available 48-96 hours after online publication and is updated daily on week days.
Initial download of the metrics may take a while.