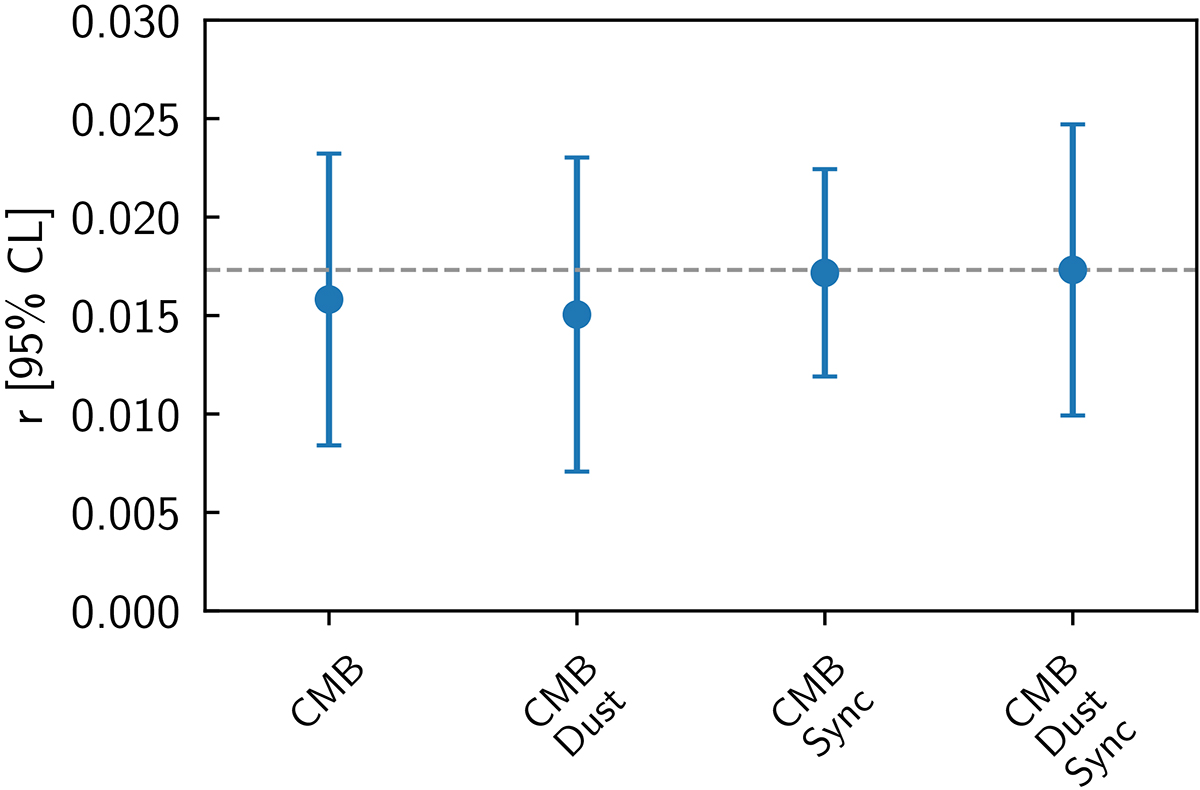
Fig. 4.
Download original image
Comparison of the upper 95% confidence limits of the tensor-to-scalar ratio posteriors for (1) CMB only; (2) CMB and thermal dust; (3) CMB and synchrotron; and (4) CMB, synchrotron, and thermal dust (in addition to noise), all evaluated for the baseline experiment configuration. Each point represents the mean of the 95% confidence limits evaluated from 20 simulations, and the error bar indicates the 68% region among the same simulations. The horizontal gray dashed line indicates the value for Case 4, representing the full model, SN10. The true input value is r = 0.
Current usage metrics show cumulative count of Article Views (full-text article views including HTML views, PDF and ePub downloads, according to the available data) and Abstracts Views on Vision4Press platform.
Data correspond to usage on the plateform after 2015. The current usage metrics is available 48-96 hours after online publication and is updated daily on week days.
Initial download of the metrics may take a while.