Fig. 2.
Download original image
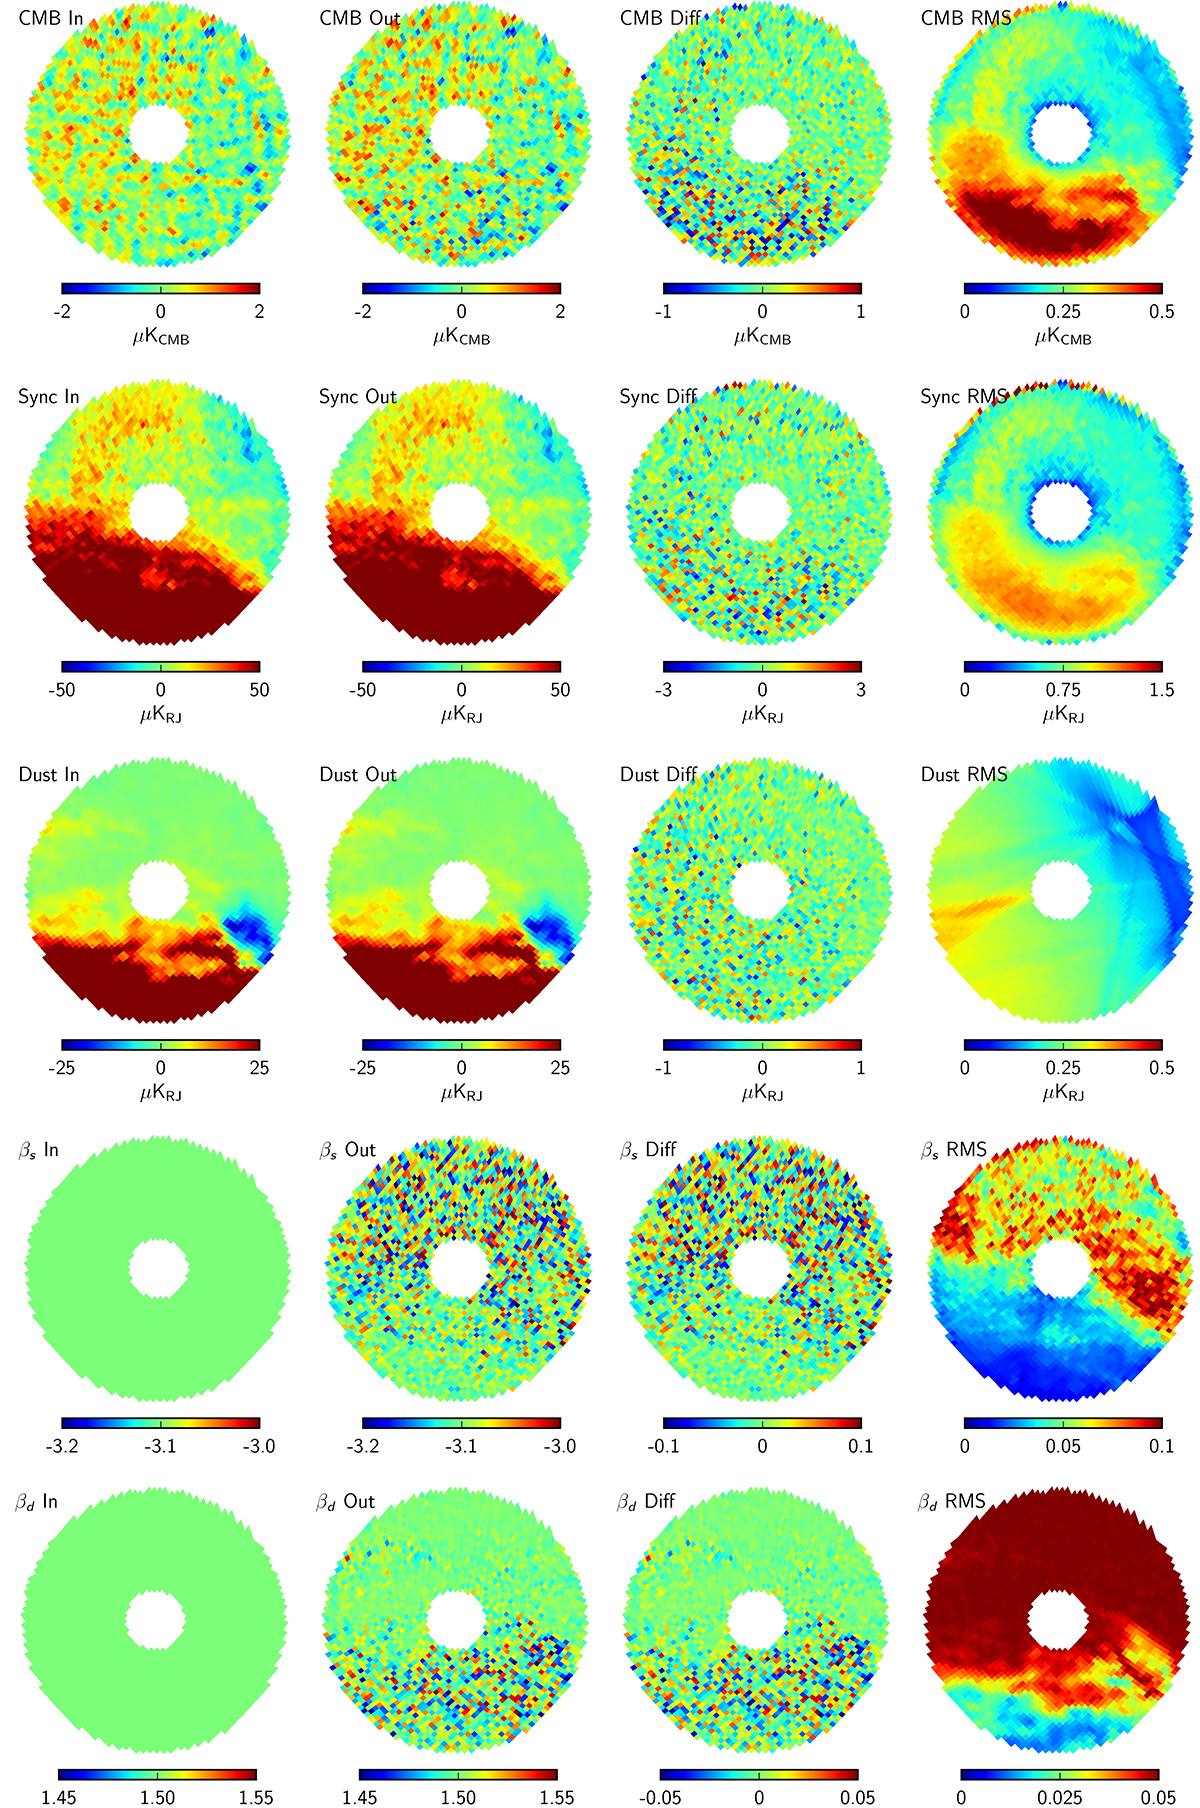
Comparison of input maps (first column), reconstructed maps (second column), residual (output minus input) maps (third column), and posterior RMS maps (fourth column) for the baseline SN10 experimental setup. From top to bottom, rows show: (1) Stokes Q CMB in thermodynamic units, (2) Stokes Q synchrotron amplitude at 23 GHz in Rayleigh-Jeans (RJ) units, (3) Stokes Q thermal dust amplitude at 353 GHz in RJ units, (4) synchrotron spectral index, and (5) thermal dust spectral index.
Current usage metrics show cumulative count of Article Views (full-text article views including HTML views, PDF and ePub downloads, according to the available data) and Abstracts Views on Vision4Press platform.
Data correspond to usage on the plateform after 2015. The current usage metrics is available 48-96 hours after online publication and is updated daily on week days.
Initial download of the metrics may take a while.