Open Access
Fig. 1.
Download original image
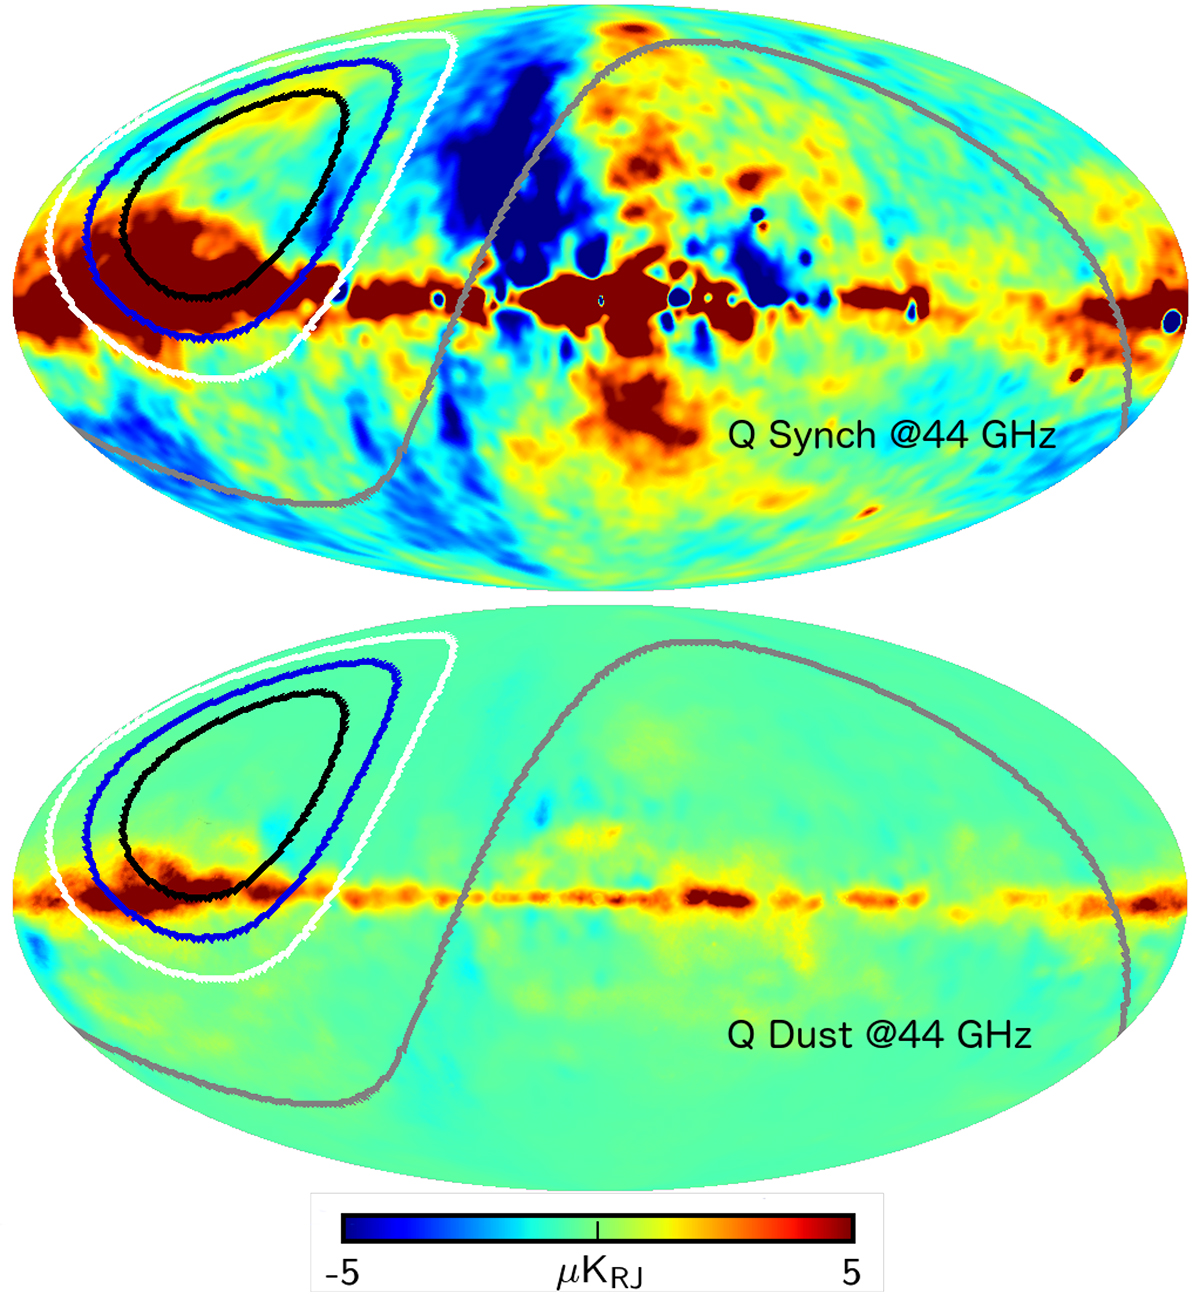
Location of the GreenPol fields superimposed on the Planck Stokes Q synchrotron emission map (top panel) and the Planck Stokes Q thermal dust emission map (bottom panel), both evaluated at 44 GHz. The lines show the location of the 10° field (black), the 20° field (blue), the 30° field (white) and the 65° field (gray).
Current usage metrics show cumulative count of Article Views (full-text article views including HTML views, PDF and ePub downloads, according to the available data) and Abstracts Views on Vision4Press platform.
Data correspond to usage on the plateform after 2015. The current usage metrics is available 48-96 hours after online publication and is updated daily on week days.
Initial download of the metrics may take a while.