Fig. 9
Download original image
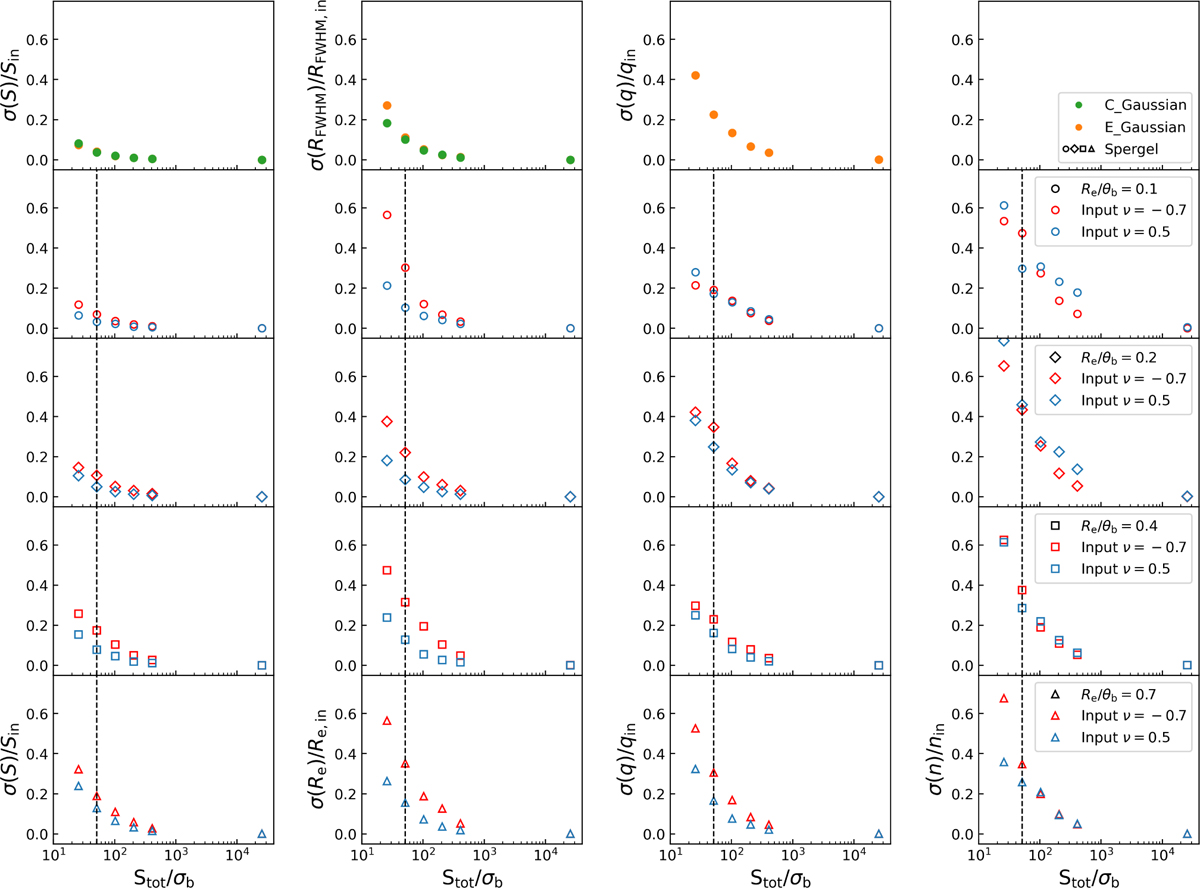
Relative accuracy of the uυ-based parameter estimates, flux density, effective radius, axis ratio, and Sérsic index (from left to right) given by cr(para)/para. Here, σ(para) is the uncertainties of the parameter estimates distribution and is calculated as 1.48×MAD, as a function of the S/N of flux density. The top panels show the results derived from fits with an elliptical Gaussian (orange) and circular Gaussian (green) model, while the results from a Spergel model uυ fit with input Re/θb of 0.1, 0.2, 0.4, and 0.7 are shown in panels from the second to fifth rows, respectively. We only display results for the cases with a Spergel index of 0.5 and −0.7 from our simulation. For other cases with a Spergel index between v = 0.5 and −0.7, the results were found to be within or close to those shown in the panels between the second and fifth rows. The dashed vertical lines represent the threshold of S tot/σb of 50.
Current usage metrics show cumulative count of Article Views (full-text article views including HTML views, PDF and ePub downloads, according to the available data) and Abstracts Views on Vision4Press platform.
Data correspond to usage on the plateform after 2015. The current usage metrics is available 48-96 hours after online publication and is updated daily on week days.
Initial download of the metrics may take a while.