Fig. 7
Download original image
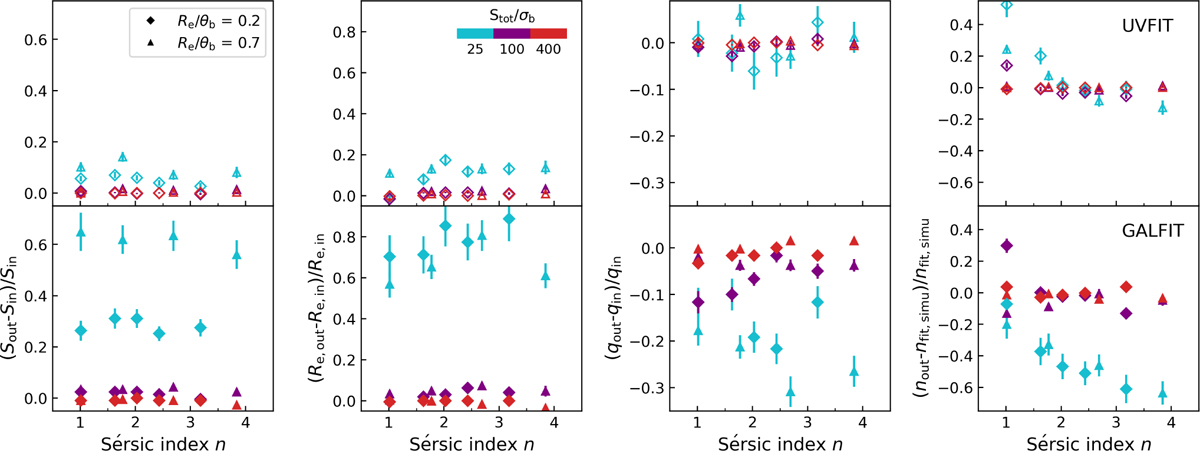
Relative difference between the input and measured parameters, flux density, effective radius, axis ratio, and Sérsic index (from left to right) obtained from Spergel fits to the uυ-plane (top panels) and Sérsic fits in the image plane using galfit (bottom panels) in our simulations plotted as a function of light concentration (i.e., Sérsic index) for various Stot/σb and source sizes. Sources with a size of Ré/θb = 0.2 and 0.7 are marked by a diamond and a triangle, respectively, while the inset panel’s color bar shows the different input flux densities. The error bars denote the interquartile range of the distribution divided by the square root of the number of simulations.
Current usage metrics show cumulative count of Article Views (full-text article views including HTML views, PDF and ePub downloads, according to the available data) and Abstracts Views on Vision4Press platform.
Data correspond to usage on the plateform after 2015. The current usage metrics is available 48-96 hours after online publication and is updated daily on week days.
Initial download of the metrics may take a while.