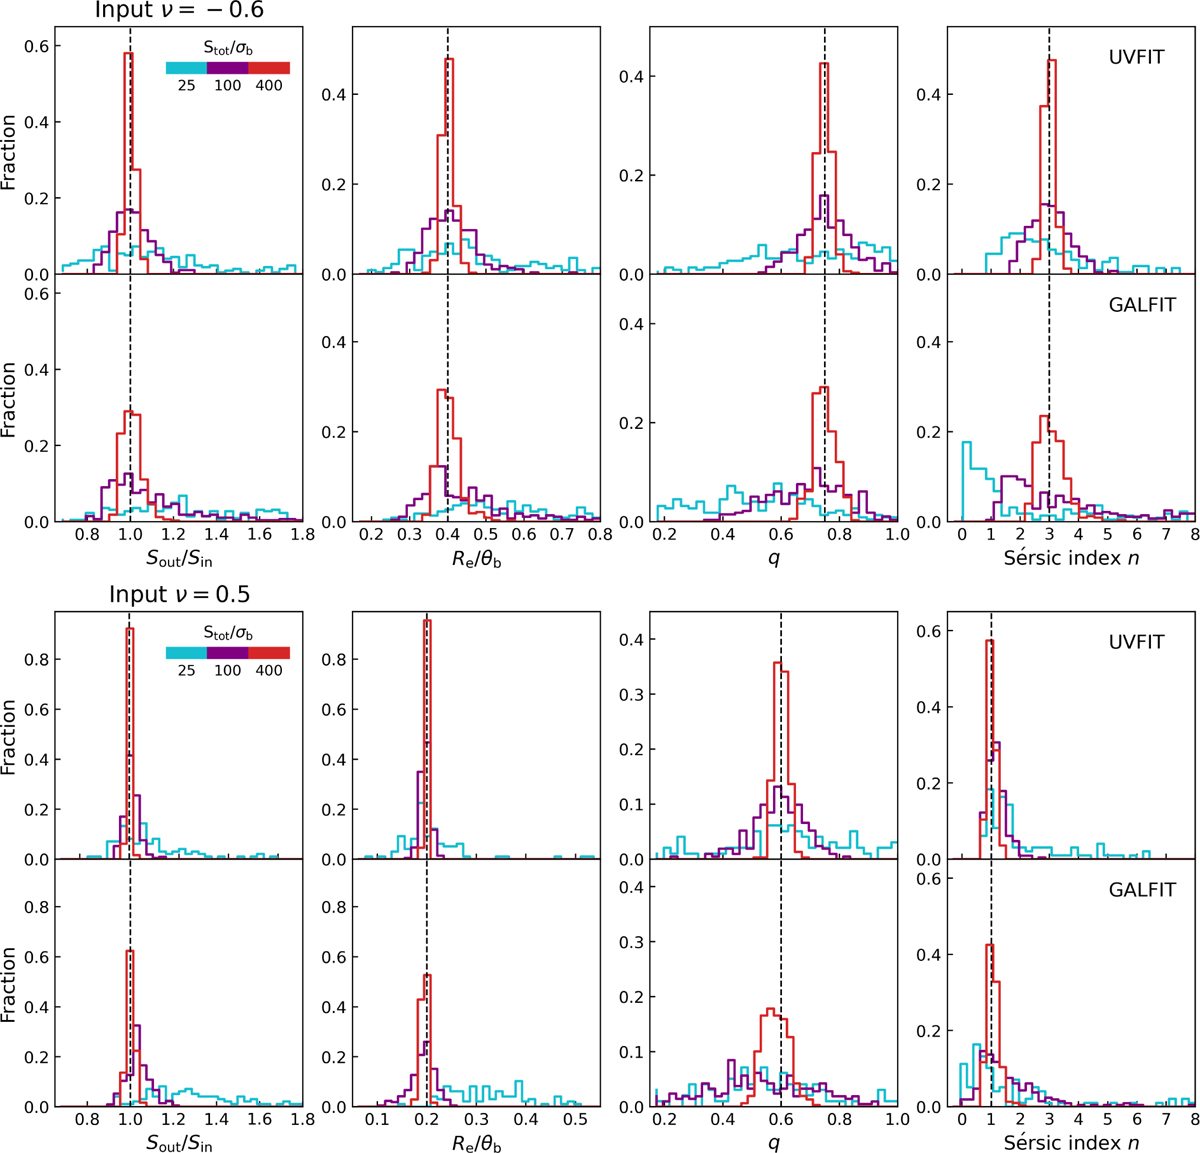
Fig. 6
Download original image
Results from simulations of a single model source. The distribution of recovered parameters from uv_fit to the visibilities (panels labelled with UVFIT) and galfit in the image plane (panels labelled with GALFIT) allowed us to measure their respective accuracy in recovering the known intrinsic parameters (dashed vertical lines), including the flux density and structural parameters (Re, q, and n). We present two examples using a Spergel profile as the input source: Re/θb = 0.4, q = 0.75, PA = 30°, v = −0.6 (two top panels), and Re/θb = 0.2, q = 0.6, PA = 30°, v = 0.5 (two bottom panels). The distribution of the recovered parameters is color coded by flux density (Stot/σb = 25, 100, and 400, indicated by different colors in the inset panel). The Sérsic indices shown in the UVFIT panels were obtained by converting the best-fit Spergel indices based on Eq. (3). For all parameters, we took into account the conversion from Spergel-based fits to Sérsic-based fits, discussed in Sect. 2 (see Eqs. (3) and (4)), to remove any underlying systematics coming from the difference in the profiles.
Current usage metrics show cumulative count of Article Views (full-text article views including HTML views, PDF and ePub downloads, according to the available data) and Abstracts Views on Vision4Press platform.
Data correspond to usage on the plateform after 2015. The current usage metrics is available 48-96 hours after online publication and is updated daily on week days.
Initial download of the metrics may take a while.