Fig. 5
Download original image
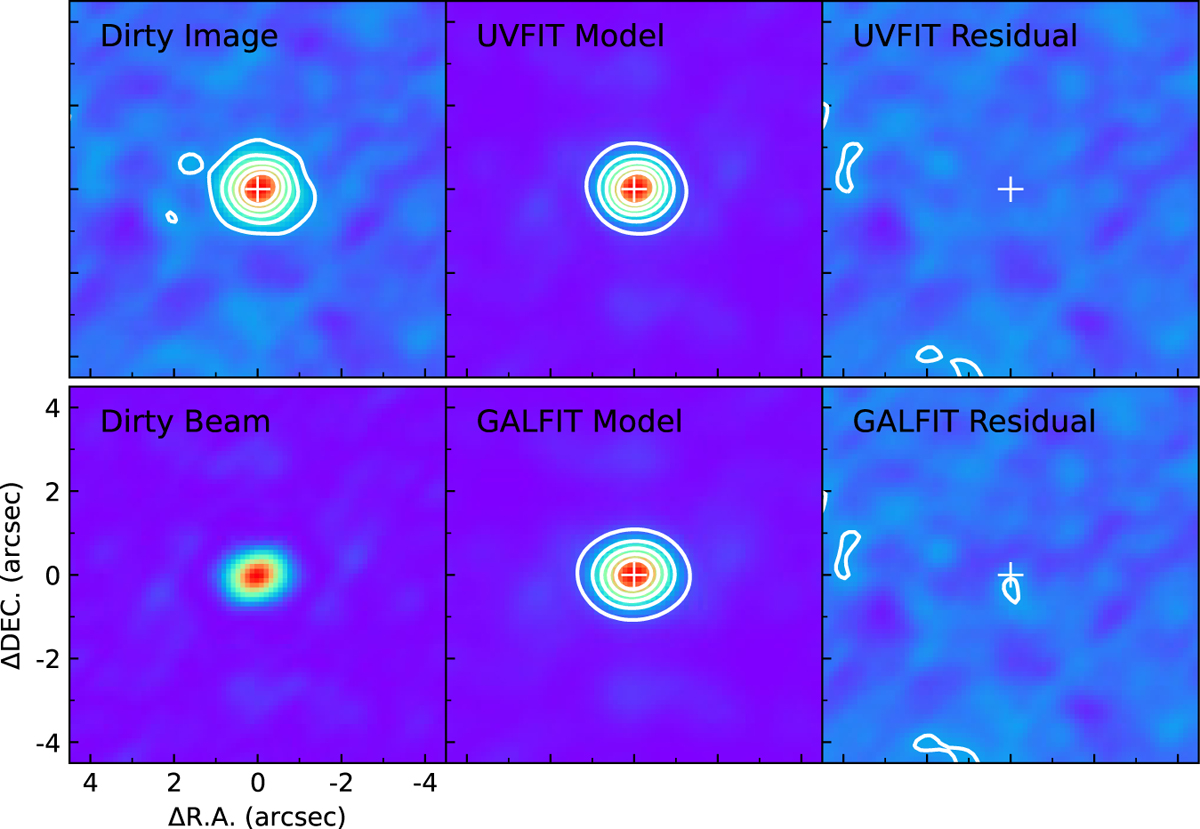
Example of a simulated source generated with a Spergel profile of Stot/σb = 50, Re/θb = 0.4, axis ratio of q = 0.75, PA = 30°, and Spergel index of v = −0.6. From left to right: the dirty image (top-left), dirty beam (PSF used for convolution in galfit; bottom-left), best-fit source models convolved with the dirty beam (middle), and residuals after subtracting the model source (right). The model source and the model-subtracted residual shown in the top and bottom rows were derived from the uv_fit and galfit fits, respectively. Each image cutout is 9″ × 9″. The contours start from 2σ and increase in steps of 4σ. White crosses mark the best-fit source position obtained from uv_fit.
Current usage metrics show cumulative count of Article Views (full-text article views including HTML views, PDF and ePub downloads, according to the available data) and Abstracts Views on Vision4Press platform.
Data correspond to usage on the plateform after 2015. The current usage metrics is available 48-96 hours after online publication and is updated daily on week days.
Initial download of the metrics may take a while.