Fig. 4
Download original image
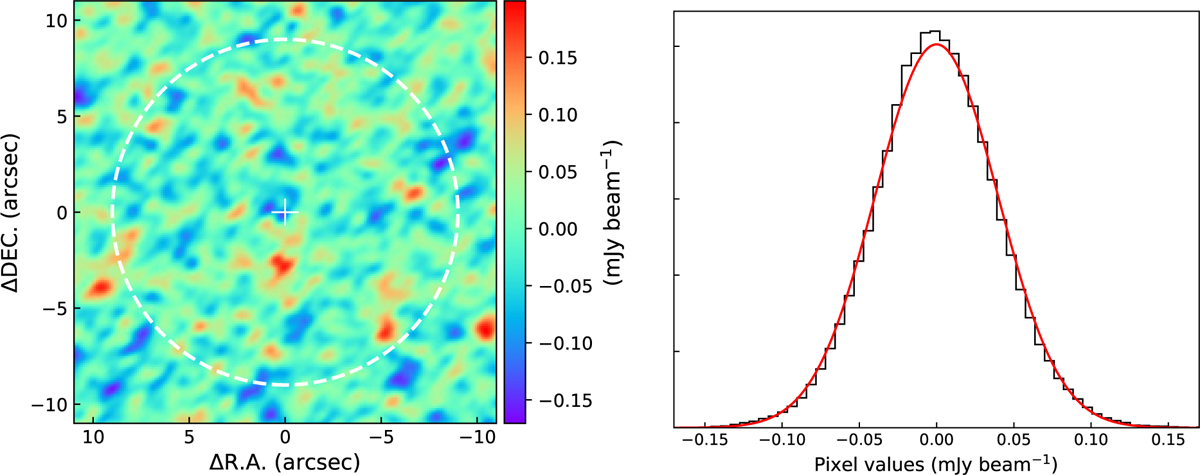
Example of an empty dataset used for our simulations. Left: noise map. The source emission (which was close to the phase center) was subtracted from the visibility data. The dashed white circle represents the primary beam (i.e., the FOV) of the dataset. Right: histogram of pixel values within the primary beam. The red line represents the best-fitting Gaussian model. The fit suggests that the noise data is at least approximately Gaussian.
Current usage metrics show cumulative count of Article Views (full-text article views including HTML views, PDF and ePub downloads, according to the available data) and Abstracts Views on Vision4Press platform.
Data correspond to usage on the plateform after 2015. The current usage metrics is available 48-96 hours after online publication and is updated daily on week days.
Initial download of the metrics may take a while.