Fig. 3
Download original image
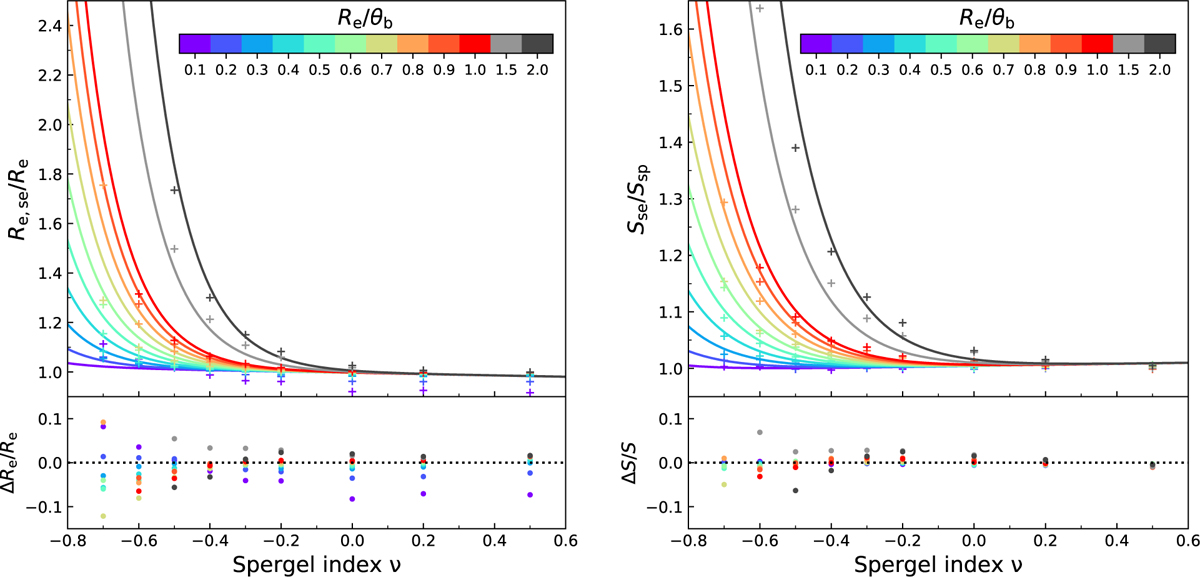
Similar to Fig. 2 but showing the ratio of effective radii (left) and total fluxes (right) obtained from fitting Sérsic models to simulated galaxies created using Spergel profiles (crosses). The data are plotted as a function of their Spergel index. The solid curves denote the best-fit empirical relations as expressed by Eq. (4). The bottom panels show the normalized residuals to the best fit, which are largely within 10%.
Current usage metrics show cumulative count of Article Views (full-text article views including HTML views, PDF and ePub downloads, according to the available data) and Abstracts Views on Vision4Press platform.
Data correspond to usage on the plateform after 2015. The current usage metrics is available 48-96 hours after online publication and is updated daily on week days.
Initial download of the metrics may take a while.